- GBP/USD met with some fresh supply on Thursday and turned lower for the third straight session.
- Technical indicators are yet to confirm a bearish bias and warrants some caution aggressive traders.
- A sustained move back above the 1.3950 strong resistance will negate any near-term bearish bias.
The GBP/USD pair struggled to capitalize on its early positive move, instead met with some fresh supply near mid-1.3900s and turned lower for the third consecutive session. The intraday downfall dragged the pair back below the 1.3900 mark, closer to the overnight swing lows during the first half of the European session.
Renewed fears about another dangerous wave of coronavirus infections in some countries continued weighing on investors’ sentiment. Apart from this, a goodish intraday bounce in the US Treasury bond yields provided a modest lift to the US dollar, which, in turn, was seen as a key factor exerting pressure on the GBP/USD pair.
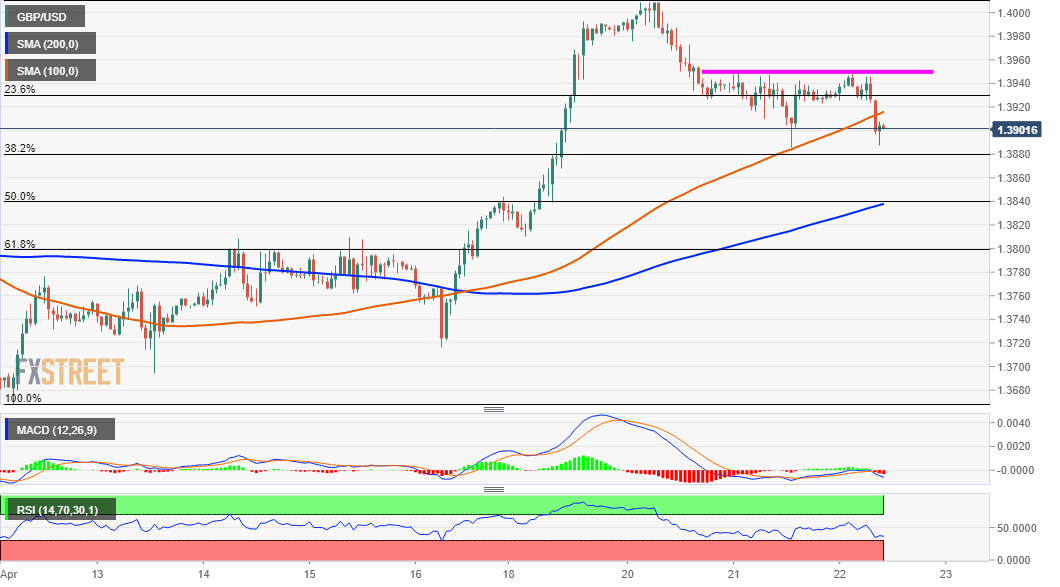
Looking at the technical picture, weakness below 100-hour SMA might be seen as a fresh trigger for intraday bearish traders. That said, the GBP/USD pair once again managed to find some support near the 1.3885-80 region, just ahead of the 38.2% Fibonacci level of the 1.3669-1.4009 move up, which should now act as a key pivotal point.
Meanwhile, technical indicators on 4-hour/daily charts maintained their bullish bias and have moved on the verge of breaking into the oversold territory on the 1-hour chart. This warrants some caution for bearish traders and makes it prudent to wait for sustained weakness below the mentioned support before positioning for any further decline.
The next relevant target on the downside is pegged near the 50% Fibo. level, around the 1.3840 region. Bears could eventually aim to test the 1.3800 mark, or the 61.8% Fibo. level support, which if broken decisively will negate any near-term positive bias and pave the way for an extension of this week’s slide from the key 1.4000 psychological mark.
On the flip side, the 1.3950 region now seems to have emerged as immediate strong resistance. A convincing breakthrough might trigger a short-covering move towards the 1.4000 mark. Some follow-through buying has the potential to push the GBP/USD pair towards the 1.4055-60 intermediate hurdle en-route the 1.4100 level.
GBP/USD 1-hour chart
Technical levels to watch
