- GBP/USD registers three-day winning streak, mildly positive near key resistance line.
- 61.8% Fibonacci retracement, 200-day SMA add to the resistance.
- A confluence of 50% Fibonacci retracement, short-term rising trend line limit immediate downside.
- Bullish MACD favors the bulls.
While extending its previous two-day rise, GBP/USD takes the bids near the intraday high of 1.2400, up 0.11% to the day, as the Asian markets gain momentum on Thursday.
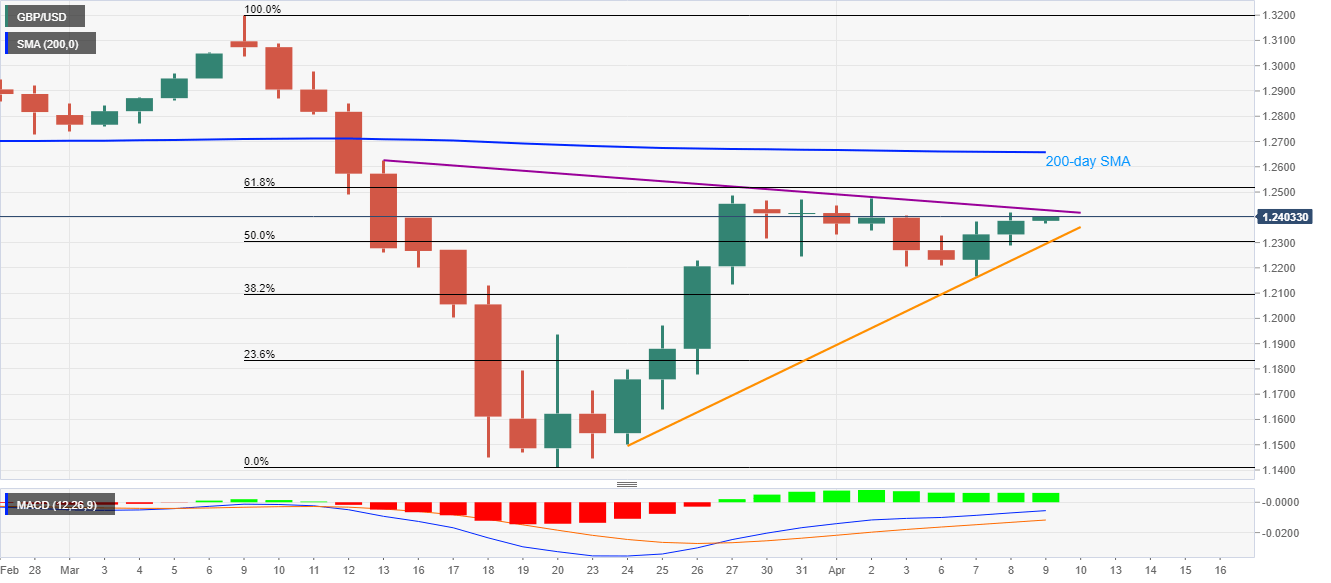
Considering the pair’s sustained run-up beyond 50% Fibonacci retracement of March month declines and bullish MACD signals, buyers are likely inching closer towards nearly a month-old falling trend line resistance, at 1.2430 now.
Should there be a clear upside past-1.2430, which is more likely, 61.8% Fibonacci retracement level of 1.2520 and 200-day SMA near 1.2660 will question the bulls.
Alternatively, an upward sloping trend line from March 14 and 50% Fibonacci retracement together restrict the pair’s near-term downside around 1.2305/2300.
GBP/USD daily chart
Trend: Further recovery expected
