- GBP/USD quickly retreated over 100 pips from two-week tops set earlier this Thursday.
- The set-up favours bearish traders and supports prospects for additional weakness.
Having shown some resilience below 100-hour SMA, the GBP/USD pair rallied to near two-week tops, around the 1.2975 region, during the mid-European session.
The strong intraday positive move faltered near a resistance marked by the 38.2% Fibonacci level of 1.3482-1.2676 recent downfall. The pair retreated over 100 pips from daily swing highs and was last seen hovering near the 23.6% Fibo. level, around the 1.2870-65 region.
The pair’s inability to capitalize on the strong move up and the subsequent fall points to persistent selling at higher levels. Meanwhile, oscillators on the daily chart maintained their bearish bias and have again started drifting into the negative territory on the 1-hourly chart.
The set-up seems tilted firmly in favour of bearish traders and supports prospects for the resumption of the recent downward trajectory. That said, it will be prudent to wait for sustained weakness below the 1.2840 region (100-hour SMA) before positioning for any further downfall.
The GBP/USD pair might then turn vulnerable to break through the 1.2800 round-figure mark. Some follow-through selling below the 1.2775 horizontal support should pave the way for a fall towards the 1.2700 mark en-route multi-week lows support, around the 1.2675 zone.
On the flip side, immediate support is pegged near the 1.2900 mark. A convincing move back above might trigger a short-covering move and assist the GBP/USD pair to aim back to conquer the key 1.3000 psychological mark.
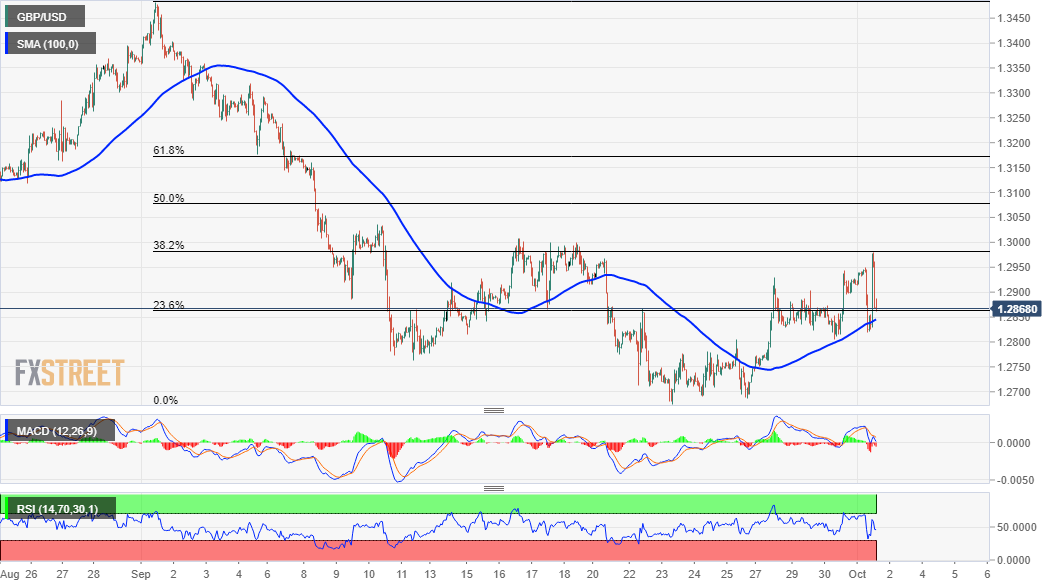
GBP/USD 1-hourly chart
Technical levels to watch
