- GBP/USD bulls attack 1.2500 while staying above 200-bar SMA.
- A clear break above 50% Fibonacci retracement will validate the bullish chart pattern.
- Strong RSI conditions, sustained trading beyond the key SMA keep buyers hopeful.
- Mid-June top could offer a small resistance ahead of June month’s top.
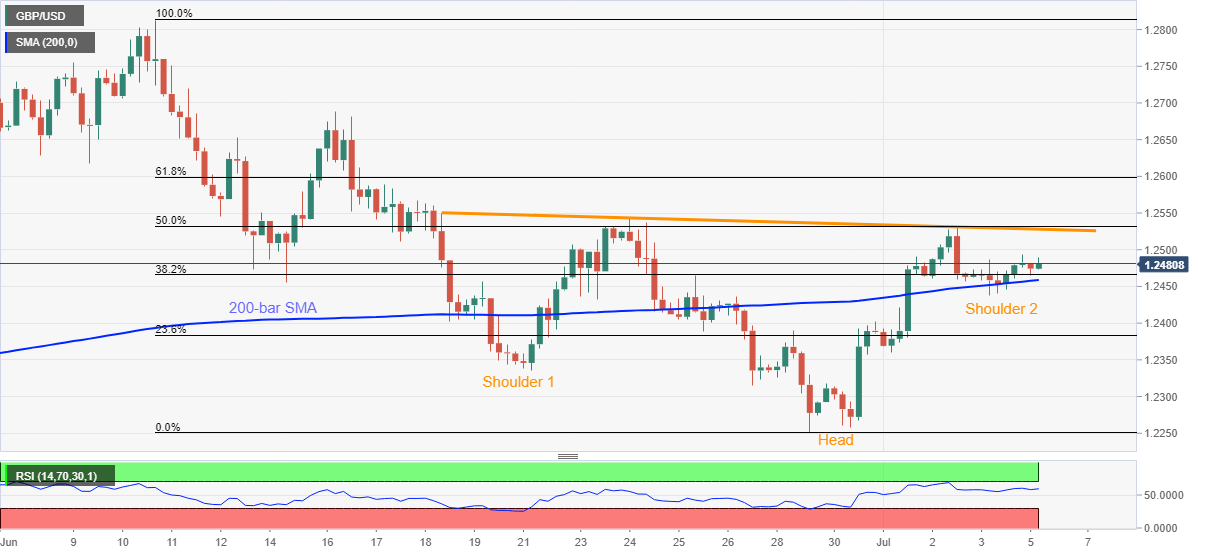
GBP/USD takes the bids near 1.2490, up 0.05% on a day, during Monday’s Asian session. In doing so, the Cable extends Friday’s bounce off 200-bar SMA to sharpen the inverse Head-And-Shoulder formation on the four-hour chart. However, the neckline of the bullish pattern joins 50% Fibonacci retracement level of June 10-29 fall to add strength to the upside barrier.
Increasing the odds of an upside break is the strong RSI condition and the pair’s sustained trading beyond 200-bar SMA.
As a result, the bulls are waiting for a clear break above 1.2535 to escalate the recent recovery moves. In doing so, the June 16 top near 1.2690 could become immediate resistance to watch ahead of the previous month’s high near 1.2815.
Meanwhile, a downside break below 200-bar SMA level of 1.2458 can quickly test 1.2400 round-figure.
Though, 1.2330 and 1.2300 might hinder the quote’s further weakness ahead of June 29 bottom surrounding 1.2250.
GBP/USD four-hour chart
Trend: Further recovery expected
