- GBP/USD added to the overnight positive move and gained some follow-through traction on Friday.
- Sustained move beyond the 23.6% Fibo. level and 100-hour SMA prompted some technical buying.
- Bearish oscillators on the daily chart warrant some caution before positioning for any further gains.
The GBP/USD pair built to the previous day’s goodish bounce from multi-week lows and gained some follow-through traction for the second straight session on Friday. The momentum extended through the first half of the European session and push the pair to three-day tops, around the 1.3785 region.
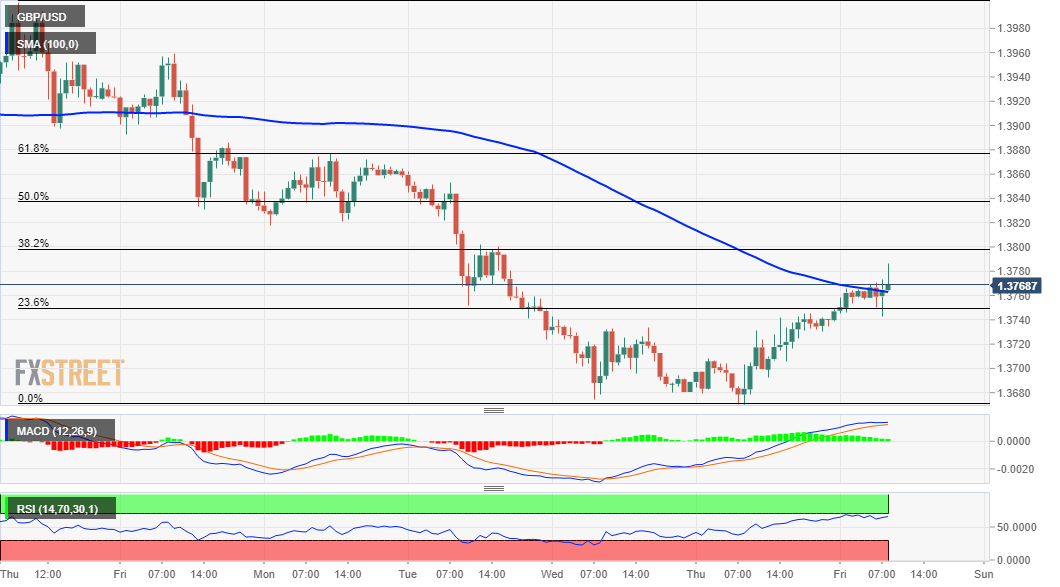
The latest leg of a sudden spike over the past hour or so could be attributed to some technical buying above the 100-hour SMA. This comes on the back of a brief consolidation near the 23.6% Fibonacci level of the 1.4002-1.3671 downfall and supports prospects for a further intraday appreciating move.
The constructive outlook is reinforced by the fact that technical indicators on the 1-hourly chart have been gaining positive traction. That said, oscillators on the daily chart are still holding in the bearish territory and might hold traders from placing aggressive bullish bets, at least for now.
Hence, any subsequent positive move is more likely to confront stiff resistance near the 1.3800 support breakpoint. This coincides with the 38.2% Fibo. level and should now act as a pivotal point for short-term traders and help determine the next leg of a directional move for the GBP/USD pair.
On the flip side, the early European session lows, around the 1.3740 region now seems to protect the immediate downside. Some follow-through selling has the potential to drag the GBP/USD pair towards the 1.3700 mark, which if broken will add credence to the recent bearish double-top breakdown.
The GBP/USD pair might then turn vulnerable to weaken further below the overnight swing lows, around the 1.3670 region. Bearish traders might eventually aim to challenge 100-day SMA support, currently near the 1.3610-1.3600 region.
GBP/USD 1-hourly chart
Technical levels to watch
