- GBP/USD pulls back from an eight-day high.
- 38.2% Fibonacci retracement, 21-day SMA limit immediate upside.
- Sellers will refrain from entry unless breaking 10-day SMA on a daily closing basis.
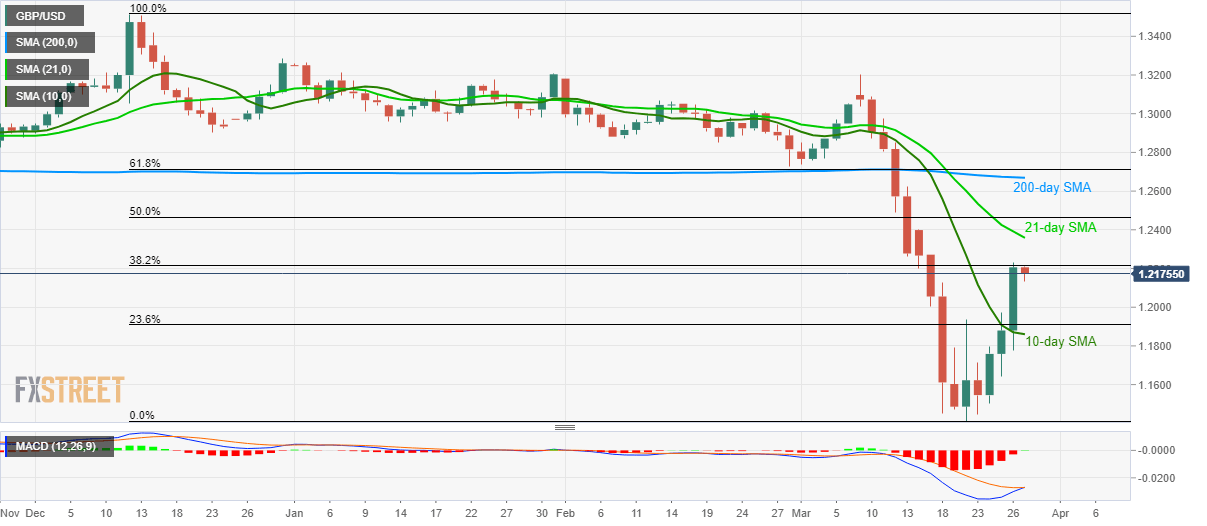
GBP/USD steps back from an eight-day high to 1.2177 during Friday’s Asian session. In doing so, the pair also respects 38.2% Fibonacci retracement of its fall from December 12, 2019, as the immediate resistance. However, sustained trading beyond 10-day SMA and likely MACD turn towards the bullish horizon keep the buyers hopeful.
As a result, a sustained break of 1.2215 immediate resistance could escalate the recovery moves towards a 21-day SMA level of 1.2360.
However, 50% Fibonacci retracement, near 1.2465, followed a 200-day SMA level of 1.2670 and 61.8% of Fibonacci retracement around 1.2710, could challenge the bulls afterward.
On the downside, sellers will refrain from entry unless the GBP/USD prices drop below the 10-day SMA level of 1.1860 on the daily closing basis. Though, 1.20000 can offer nearby rest during the pair’s further declines.
In a case where the quote remains below 1.1860, 1.1630 and 1.1410 regain the bears’ attention.
GBP/USD daily chart
Trend: Bullish
