- GBP/USD wavers around the 1.3000 psychological magnet after bouncing off six-week low.
- Sustained break of 50% Fibonacci retracement may take clues from MACD to attack 1.3135/40 resistance confluence.
- 61.8% of Fibonacci retracement can offer immediate support below 1.2887.
GBP/USD stays modestly changed around 1.3000 during Thursday’s Asian session. The Cable bounced off late-July lows the previous day while the MACD conditions are suggesting further recovery.
As a result, the bulls can aim for August 24 low near 1.3060 as nearby resistance on the break of the latest high of 1.3023.
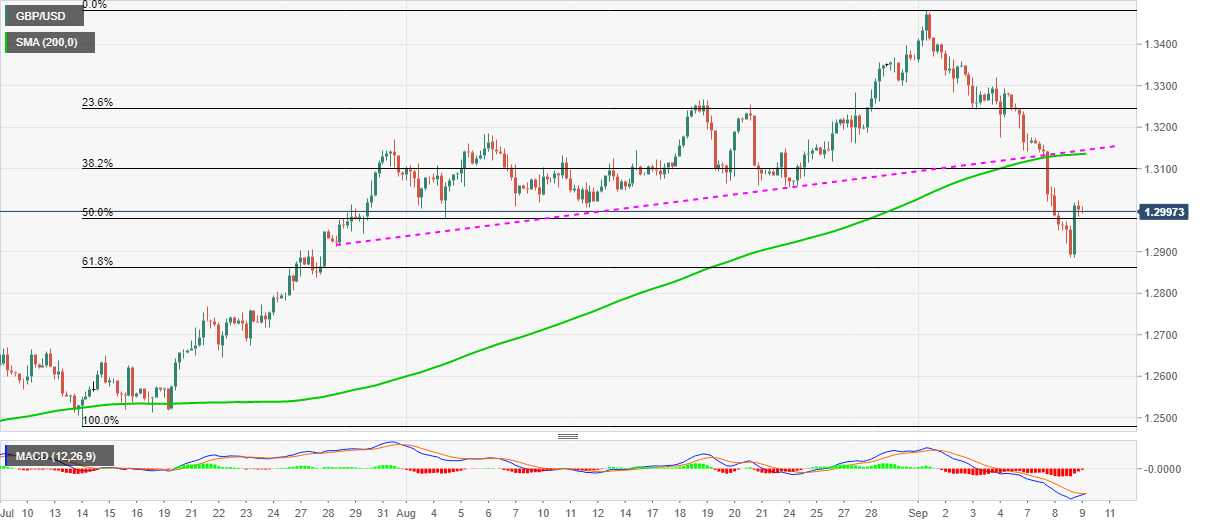
However, a confluence of 200-bar SMA and an upward sloping trend line from July 29, near 1.3135/40 will question the bulls afterward.
Meanwhile, a downside break of the recent low near 1.2885 will drag the quote to a 61.8% Fibonacci retracement of July 14 to September 01 high, around 1.2860.
If at all the bears remain dominant past-1.2860, July 21 peak surrounding 1.2765 will be on their radars.
GBP/USD four-hour chart
Trend: Further recovery expected
