- GBP/USD trades positive close to the monthly high.
- 61.8% Fibonacci retracement, 50/200-day SMAs limit further upside.
- A three-week-old rising trend line restricts immediate declines.
GBP/USD takes the bids to 1.2520 during the Asian session on Tuesday. That said, the Cable currently trades near the monthly top while also confronting 61.8% Fibonacci retracement of March month downside.
As a result, the pair’s further upside depends upon how well it manages to cross the key resistances.
Not only 61.8% Fibonacci retracement level of 1.2520, 50-day and 200-day SMAs, respectively near 1.2580 and 1.2660, also questions the pair’s additional run-up.
Alternatively, sellers will look for entry below the short-term rising support trend line, currently at 1.2485.
Should the pair drops below 1.2485 on a daily closing basis, the return of the present month low near 1.2165 can’t be ruled out.
GBP/USD daily chart
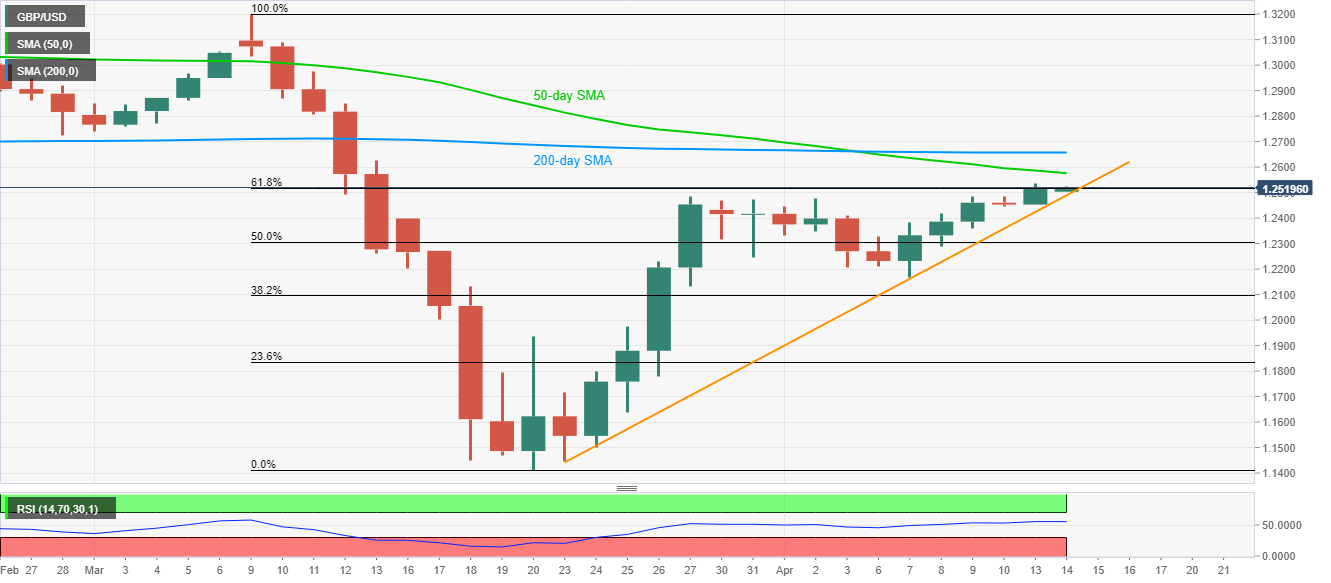
Trend: Pullback expected
