- GBP/USD extends the previous day’s recovery moves from 1.3530.
- Bullish candlestick formation, sustained trading above 21-day SMA favor buyers.
- Monthly resistance line adds to the upside barriers.
GBP/USD picks up bids around 1.3590 amid the initial Asian trading session on Tuesday. In doing so, the Cable justifies its bounce off 21-day SMA and a bullish pin bar candlestick pattern on the daily (1D) chart.
With the normal RSI conditions joining the aforementioned price-positive catalysts, GBP/USD is for regaining its status above the 1.3600 mark. However, there are multiple upside barriers near 1.3660 that test the bulls afterward.
Also acting as the key resistance are the 1.3700 round-figure and an ascending trend line from January 04, at 1.3715 now.
Alternatively, a daily closing below 21-day SMA of 1.3573 will recall GBP/USD sellers targeting an ascending trend line from December 22, currently around 1.3515.
It should, however, be noted that any further weakness past-1.3515 will not hesitate to probe a five-week-old support line near 1.3375.
GBP/USD daily chart
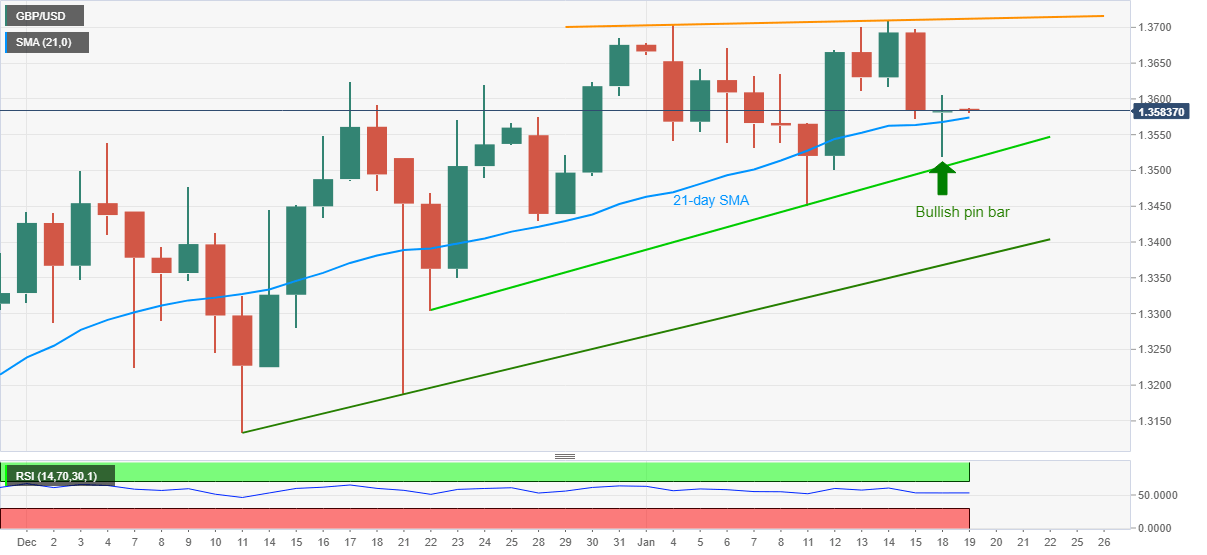
Trend: Bullish
