- GBP/USD wavers below 1.2900 after snapping a three-day winning streak the previous day.
- The key EMAs probe bearish candlestick formation, MACD turns strongest in a month.
- Mid-September tops add to the upside barriers past-1.2980.
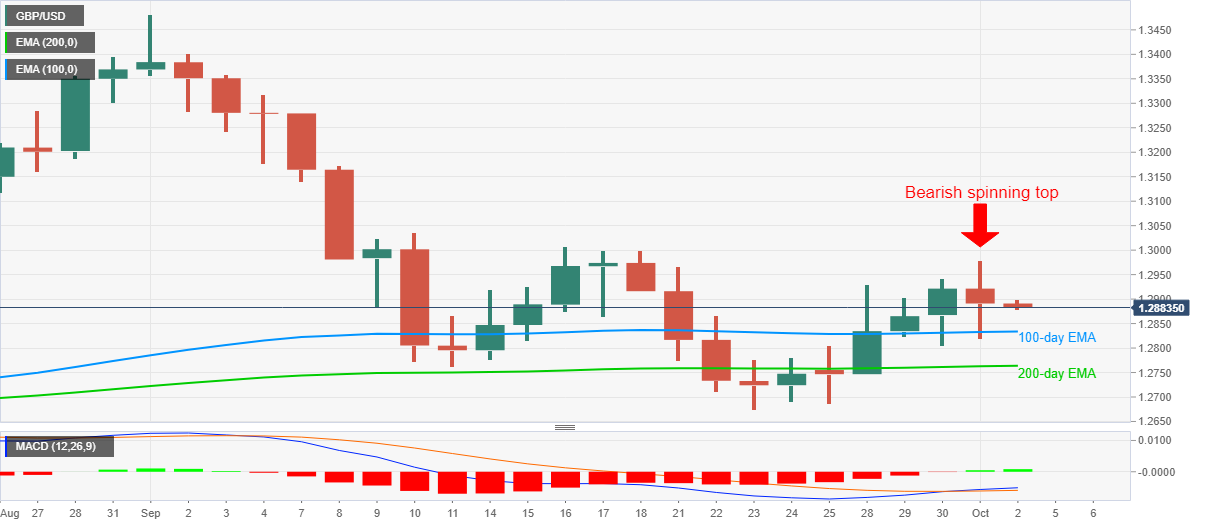
GBP/USD drops to 1.2880 as markets in Tokyo open for Friday’s trading. Even so, the quote stays mostly unchanged on a daily basis. The pair took a U-turn from 1.2819 to refresh a two week high the previous day. Though, following stabilization below the 1.2900 mark flashed the bearish spinning top candlestick on the daily chart.
Even so, 100-day and 200-day EMA offer the key support to the GBP/USD prices while MACD flashes the strongest bullish signals since early September.
Hence, the pair’s latest weakness may extend towards 100-day EMA near 1.2830. Though, any further downside will be restricted by the 200-day EMA level of 1.2763.
If at all the GBP/USD sellers conquer 1.276 support, the September month’s bottom close to 1.2675 will challenge the pair’s additional south-run.
On the flip side, a daily close beyond Thursday’s high of 1.2978 can aim for the September 16 peak surrounding 1.3010 and September 10 high of 1.3035 during the further recovery.
GBP/USD daily chart
Trend: Sideways
