- GBP/USD steps back from two-week-old horizontal resistance.
- Good Friday holidays limit immediate moves.
- A two-day-old support line, 200-HMA could question sellers.
- Buyers may target 50-day and 200-day SMAs during the successful upside.
While stepping back from a fortnight-old resistance, GBP/USD trades near 1.2450, currently around 1.2460, amid the early part of generally less liquid Good Friday.
Considering the pair’s latest pullback moves, odds of its drop to the immediate support line, around 1.2425 are much brighter.
Though, 1.2400 round-figure and 200-bar SMA near 1.2355 will limit the pair’s further declines.
Alternatively, an upside clearance of March 27 high surrounding 1.2485 could propel buyers to target 50-day and 200-day SMAs on the daily chart, respectively at 1.2560 and 1.2660.
GBP/USD hourly chart
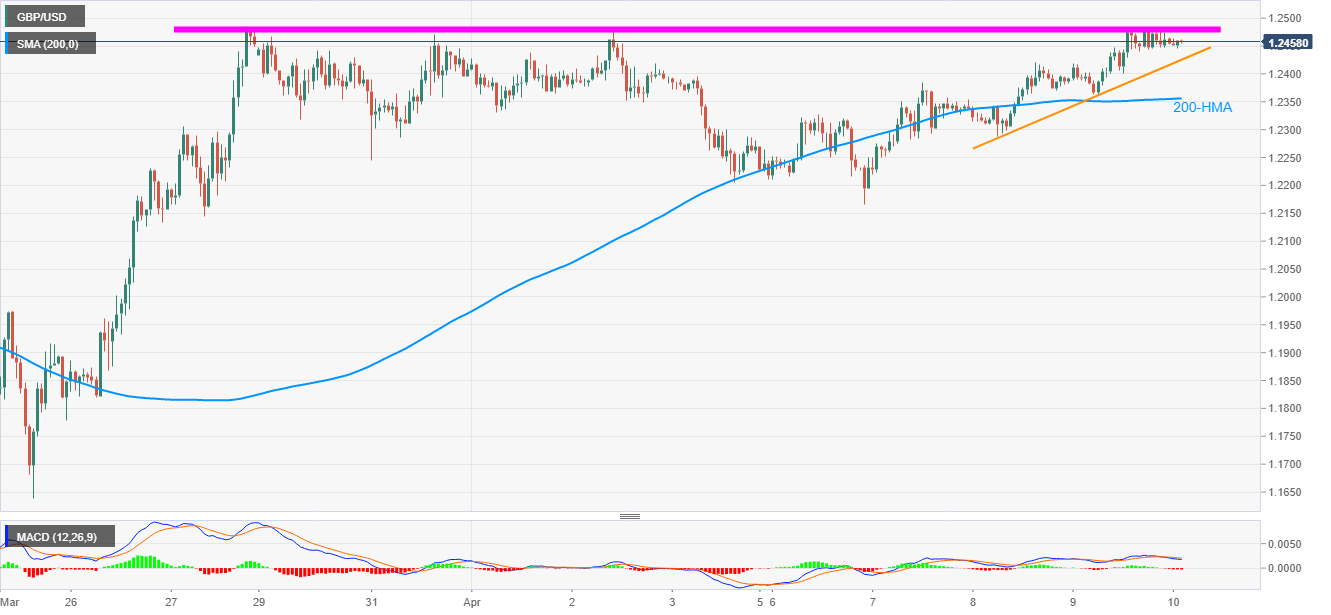
Trend: Pullback expected
