- GBP/USD carries the previous losses.
- 50% Fibonacci retracement can offer intermediate rest during the drop towards 1.2710/2700 support confluence.
- 23.6% of Fibonacci retracement acts as the near-term key resistance.
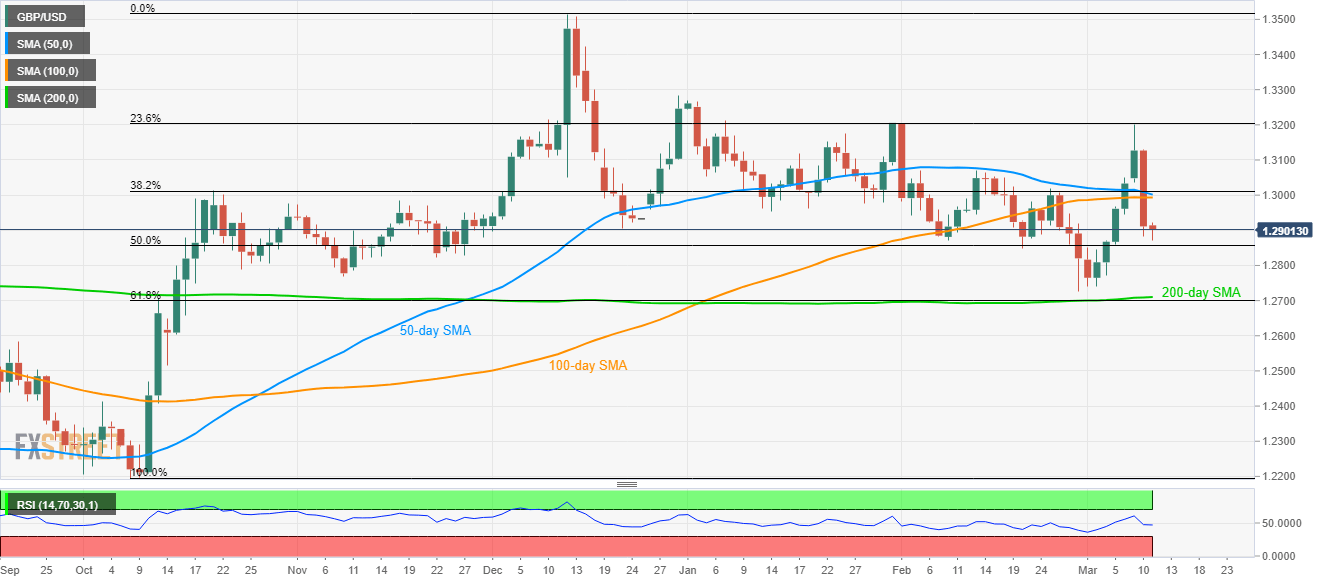
While extending its fall below 50-day and 100-day SMA, GBP/USD marks 0.08% losses to 1.2900 during the Asian session on Wednesday.
The pair currently aims to revisit 50% Fibonacci retracement of its October-December 2019 upside, around 1.2855, ahead of visiting a confluence of 200-day SMA and 61.8% Fibonacci retracement near 1.2710/2700.
Though, low registered during November 2019 close to 1.2770 can offer intermediate stop during the south-run.
On the contrary, 100-day SMA around 1.2990, followed by a 50-day SMA level of 1.3000 can question the pair’s bounce, which if broken can recall 1.3075/80 area back to the chart.
However, 23.6% of Fibonacci retracement surrounding 1.3200 will keep offering the key upside barrier for the pair.
GBP/USD daily chart
Trend: Bearish
