- GBP/USD takes the bids near a three-month top above 1.2700.
- Sustained break of the key SMA keeps buyers hopeful.
- An ascending trend line from March 20 offers strong downside support.
GBP/USD stays positive around 1.2735, intraday high of 1.2741, while keeping the upside break of 200-day SMA during the early Asian session on Tuesday. With the successful trading above the key SMA, the Cable is likely to extend the latest run-up.
Read: BRC May total sales -5.9% YoY vs April -19.1% pct YoY, second-biggest fall since records began in 1995
As a result, buyers may aim for 1.2800 round-figure during the pair’s further upside ahead of confronting a downward sloping trend line from December 13, 2019, currently near 1.2870.
Should the bulls manage to dominate past-1.2870, 1.3000 and March month high near 1.3200 could return to the charts.
On the downside, a daily closing below 200-day SMA level of 1.2685 could trigger a fresh decline towards May 08 top near 1.2465.
It should, however, be noted that the buyers may not disappoint unless the pair trades above an upward sloping trend line from March 20, at 1.2345 now.
GBP/USD daily chart
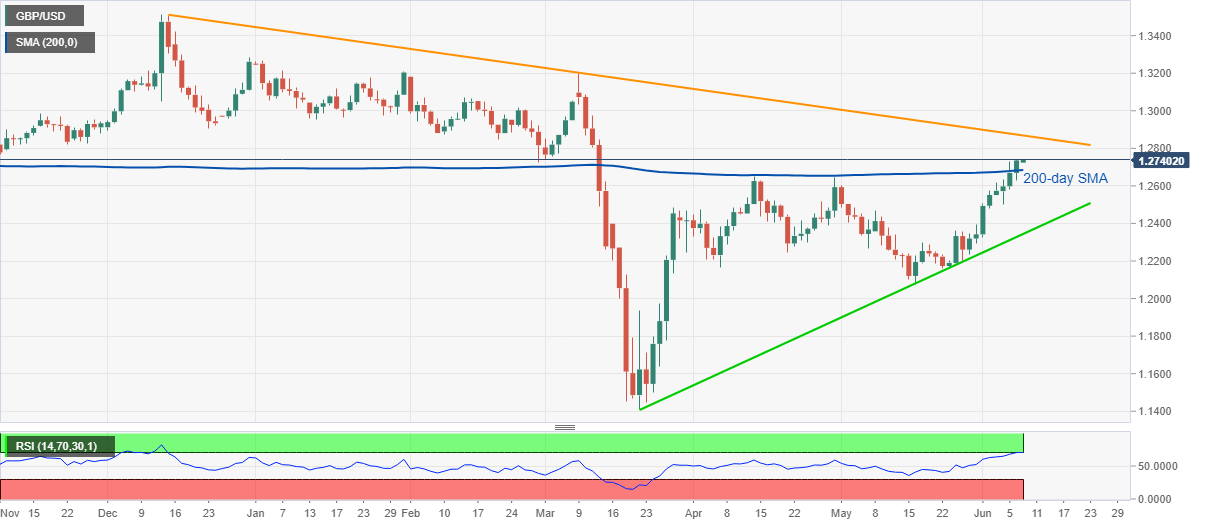
Trend: Bullish
