- GBP/USD retraces gains from the five-week high.
- Sustained trading beyond 200-bar SMA, 61.8% Fibonacci retracement keep buyers hopeful.
- A three-week-old ascending trend line adds to the support.
- Overbought RSI conditions favor a pullback.
GBP/USD consolidates gains to 1.2625 during Wednesday’s Asian session. That said, the cable remains inside a one-week-old rising trend channel while stepping back from the highest levels since March 12, 2020.
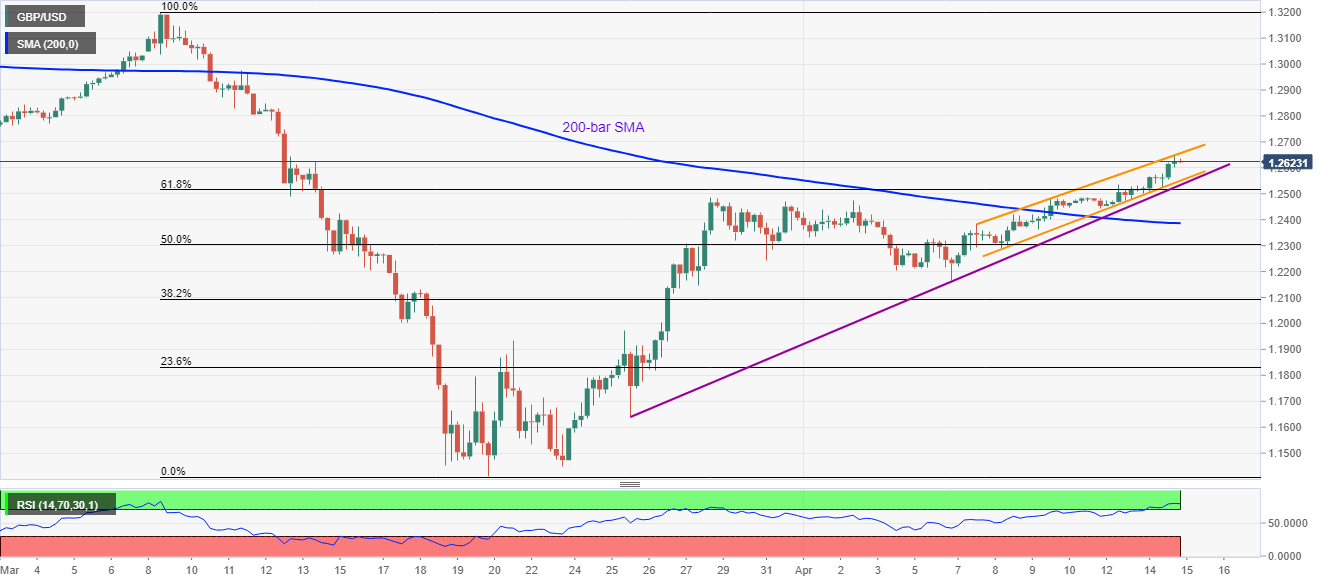
In addition to the bullish channel formation, the pair’s successful trading above 61.8% Fibonacci retracement of March month downside and 200-bar SMA also portrays underlying strength in the momentum.
However, overbought RSI conditions signal a further pullback towards the channel’s support line near 1.2550m, a break of which could fetch the quote to the three-week-old ascending trend line, at 1.2535 now.
If at all the pair drops below 1.2535, 61.8% Fibonacci retracement level of 1.2515 will question further selling ahead of highlighting 1.2385 mark, comprising 200-bar SMA, for the sellers.
On the upside, a sustained break of 1.2660 defies the channel pattern and could accelerate the run-up towards the early-March lows near 1.2740.
GBP/USD four-hour chart
Trend: Bullish
