- GBP/USD registers a five-day winning streak.
- A confluence of 50% Fibonacci retracement and the descending trend line from December 31, 2019, becomes the key.
- 50 and 100-day SMAs can offer immediate supports during the pullback.
Despite slipping back from the intra-day high of 1.3105, GBP/USD stays positive while taking rounds to 1.3095 during the Asian session on Monday.
Not only its ability to cross a downward sloping trend line since December 12, 2019, but a sustained run-up beyond 50 and 100-day SMAs also portrays the underlying strength in momentum.
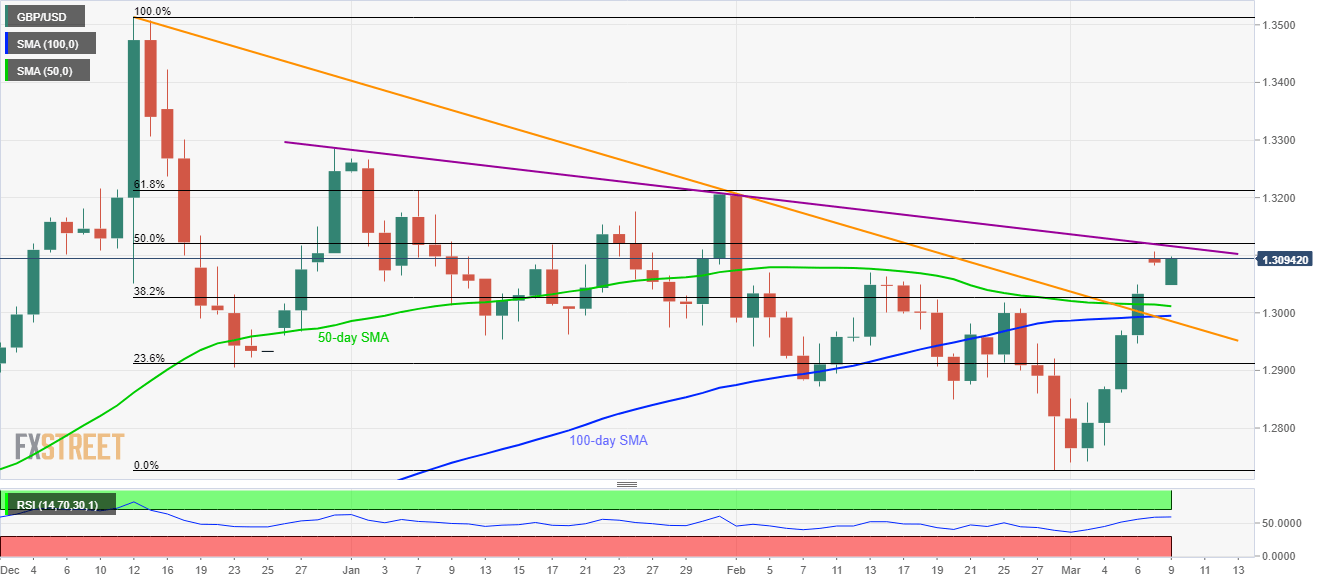
That said, GBP/USD prices are now rising towards a confluence of 50% Fibonacci retracement of its declines from December 2019 to February 2020 as well as a falling trend line from December 31, 2019, around 1.3115/20.
Should the bulls manage to keep the reins past-1.3120, January-end high close to 1.3210 as well as 61.8% Fibonacci retracement near 1.3215 will be important to watch.
On the contrary, 38.2% Fibonacci retracement near 1.3030 can act as the closest support in a case of the pair’s pullback.
Though 50-day and 100-day SMAs, respectively near 1.3010 and 1.2995, can question the pair’s further declines below 1.3030, if not then the broader support line around 1.2985 will be on the bears’ radars.
GBP/USD daily chart
Trend: Bullish
