- GBP/USD is bouncing off the lowest point since 1985.
- GBP/USD correction up is stabilizing near 1.1800 figure.
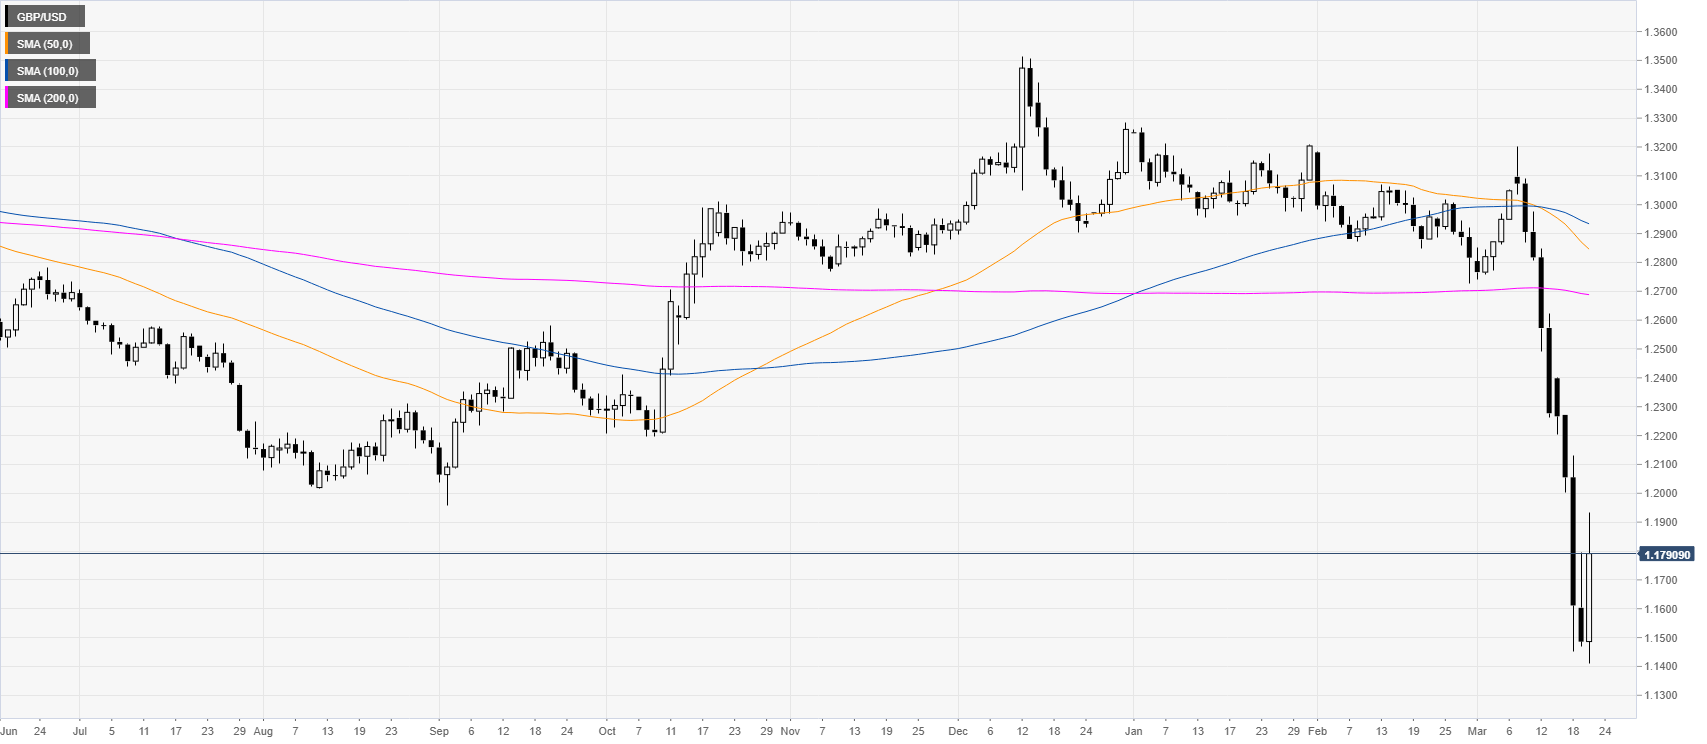
GBP/USD daily chart
This Thursday, the Bank of England (BOE) cut interest rates and added 200 billion in Quantitative Easing (QE). GBP/USD is currently rebounding from the 1985 lows.
GBP/USD four-hour chart
GBP/USD is correcting higher while trading well below its main SMAs, suggesting an overall bearish bias. The 1.1700, 1.1800 and 1.1900 figures are acting as resistance as the current rebound could be classified as a dead-cat-bounce, which implies that the market could remain vulnerable to the downside. Bears would need to regain the 1.1700 level on a daily closing basis.
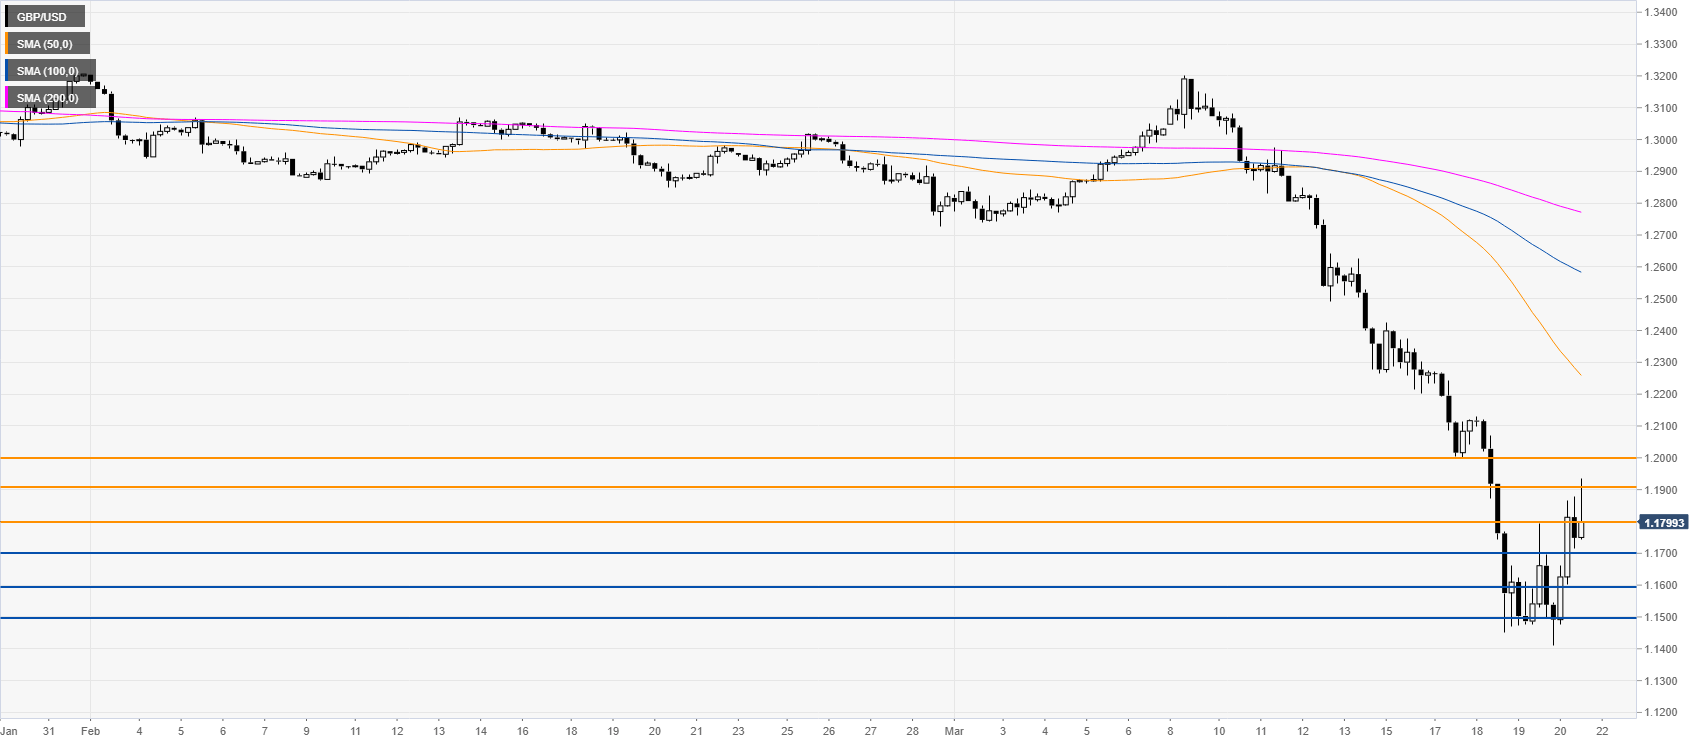
Resistance: 1.1600, 1.1730, 1.1800
Support: 1.1485, 1.1400, 1.1300
Additional key levels
