- GBP/USD is extending the correction down below the 1.3100 handle.
- The level to beat for sellers is the 1.3068 support level.
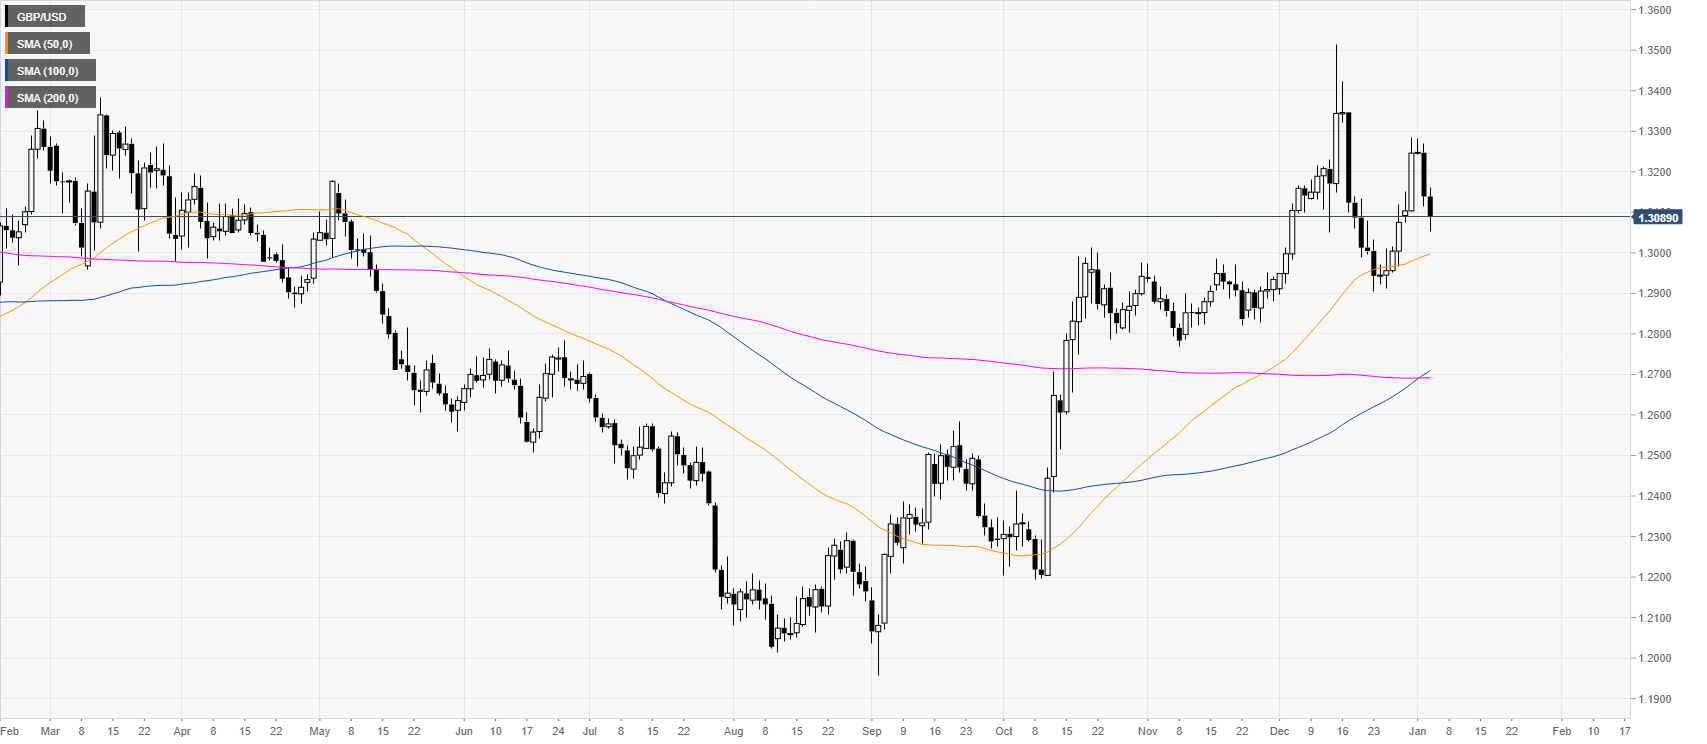
GBP/USD daily chart
GBP/USD is starting 2020 by retracing down rejecting the 1.3300 handle. As the market seems to create a lower high, the correction down could extend towards the 1.3000 and 1.2900 handles. The FOMC at 19:00 GMT can lead to high volatility in USD-related currency pairs.
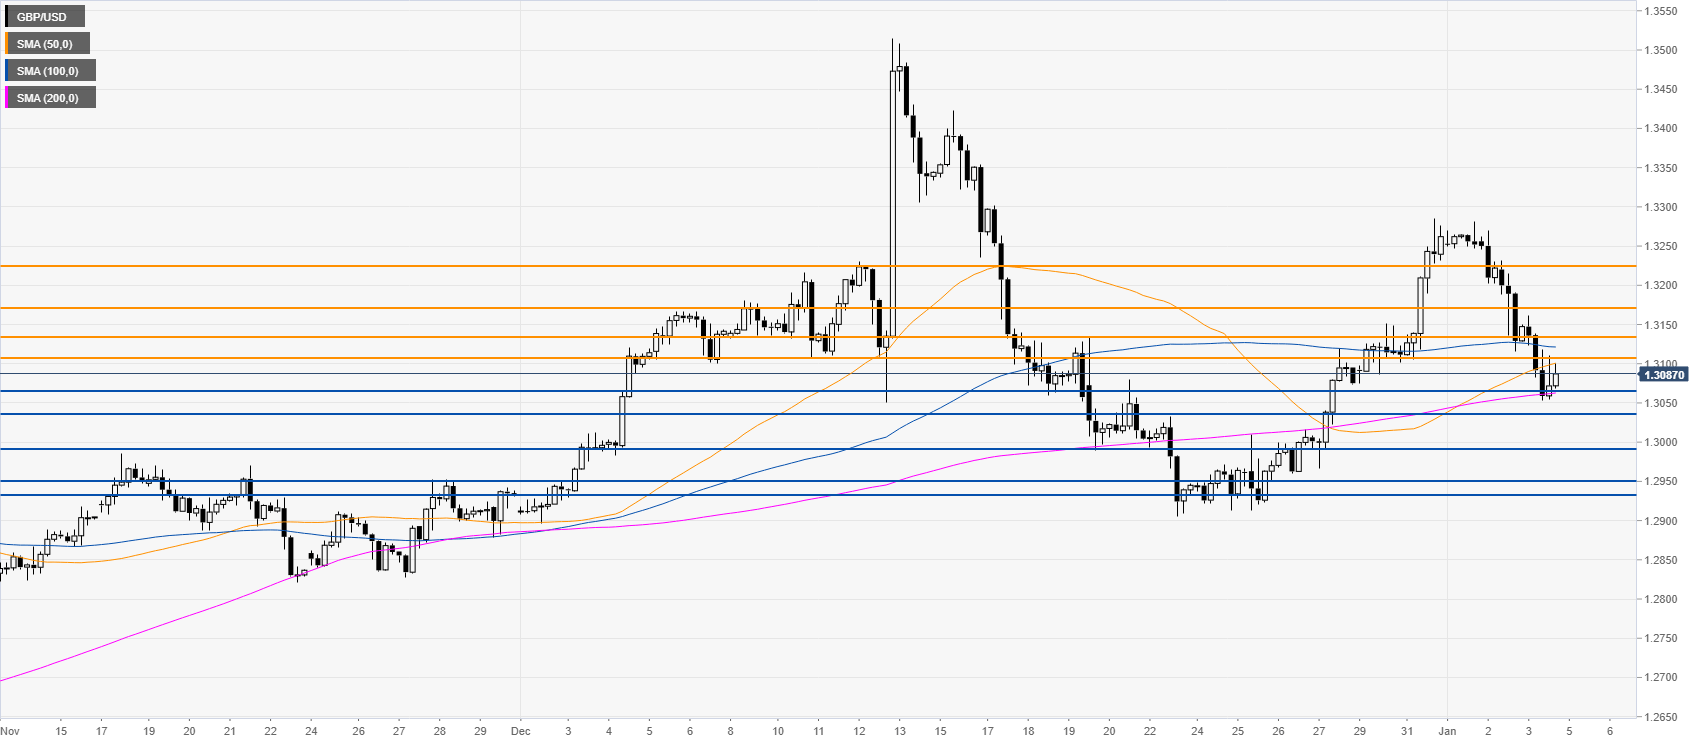
GBP/USD four-hour chart
The market is under selling pressure below the 1.3100 handle and the 50/100 SMAs. As the sellers are in control, the market will likely try to break below 1.3068 support and might continue to retrace down towards 1.3040, 1.2990 and 1.2950/32 price zone, according to the Technical Confluences Indicator. Bullish attacks could be limited near the 1.3110 and 1.3136 level. However, a daily break above the latter can lead to further potential gains towards the 1.3176 and 1.3220 levels.
Additional key levels
