- GBP/USD is bouncing from four-month lows, nearing the 1.2700 figure.
- GBP/USD remains vulnerable to the downside.
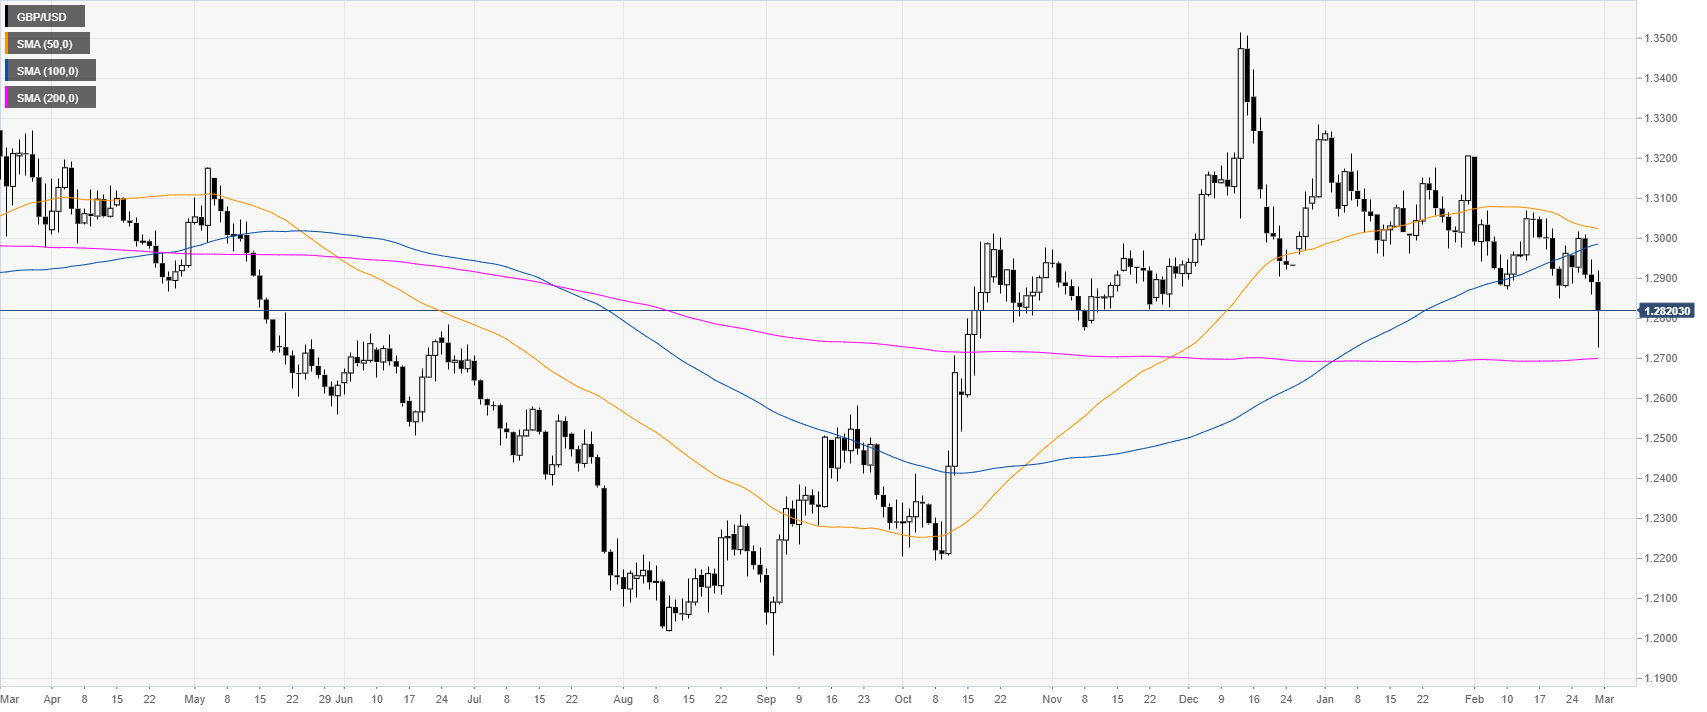
GBP/USD daily chart
GBP/USD is dropping below the 1.2900 figure and the 50/100-day simple moving averages (SMAs) as the market is bouncing from levels not seen since October 2019.
GBP/USD four-hour chart
Pound/Dollar is recovering slightly while trading below its main SMAs. The path of least resistance is to the downside with targets near the 1.2700, 1.2657 and 1.2600 levels. On the flip side, bullish incursions could find resistance near the 1.2820, 1.2858 and 1.2900 levels, according to the Technical Confluences Indicator.
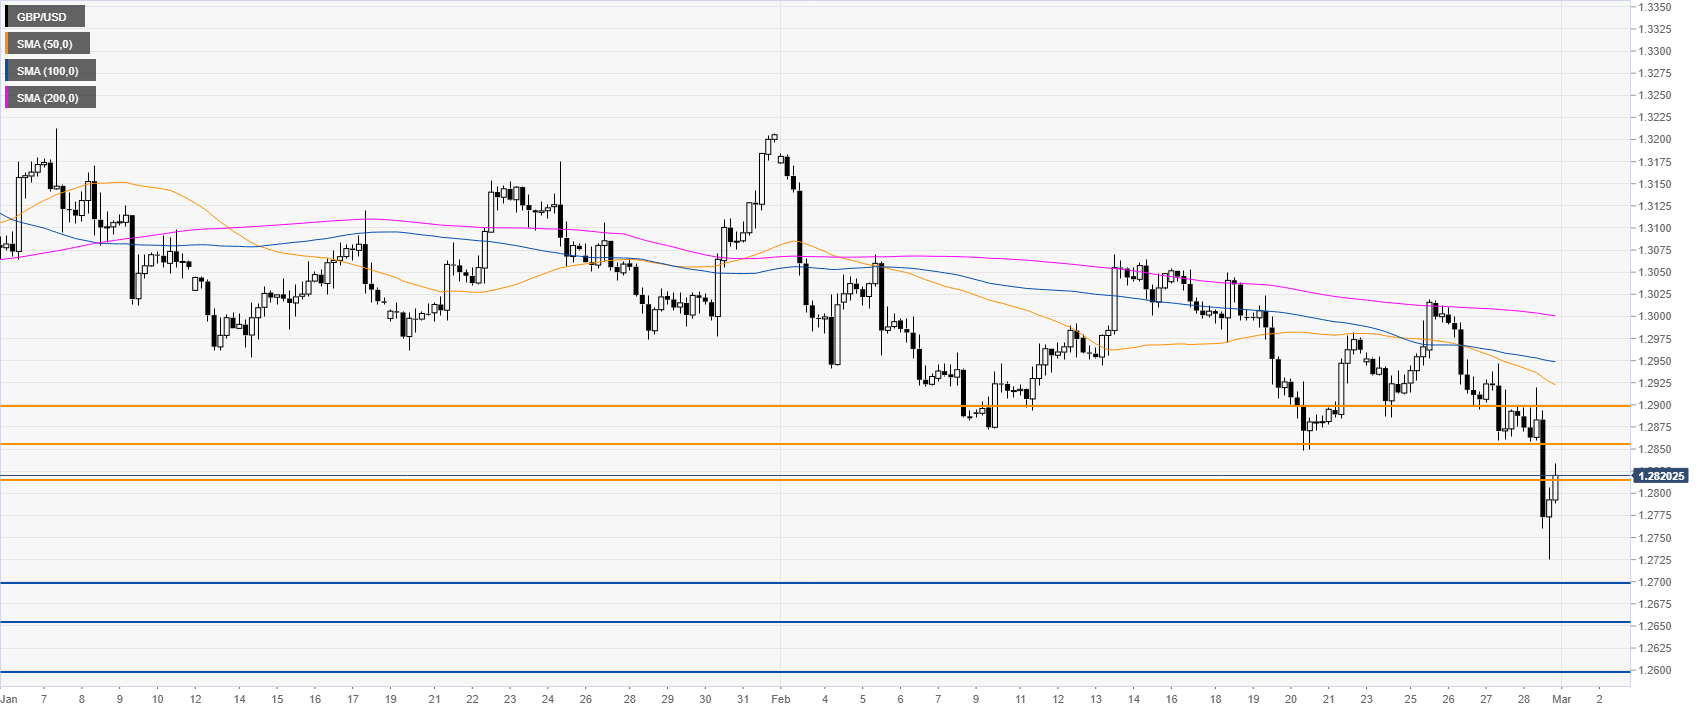
Resistance: 1.2820, 1.2858, 1.2900
Support: 1.2700, 1.2657, 1.2600
Additional key levels
