- GBP/USD bullish recovery remains intact despite the small dip to the 1.2500 figure.
- The level to beat for bulls is the 1.2600 resistance.
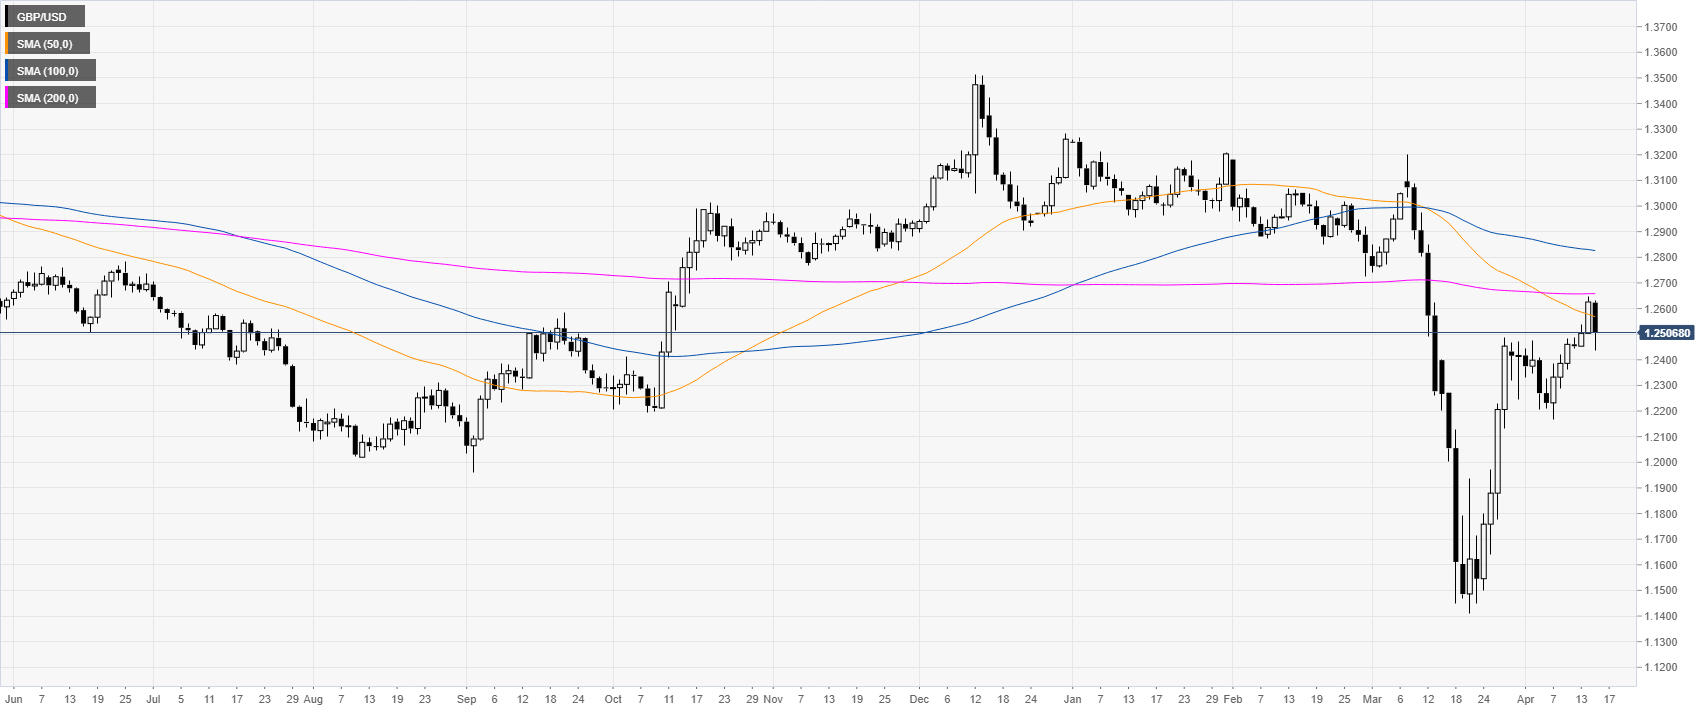
GBP/USD daily chart
GBP/USD is dipping down while rejecting the 1.2600 figure and the 200 SMA on the daily chart.
GBP/USD four-hour chart
The cable is trading above its main SMAs on the four-hour chart suggesting a positive bias in the medium-term. The spot is bouncing from the 1.2500 figure as the market retains its bullishness still making higher highs and lows. However, bulls would need a daily close above the 1.2600 figure en route to the 1.2700 and 1.2800 levels on the way up. On the flip side, support is expected to emerge near the 1.2500 and 1.2400 level near the 50/200 SMAs.
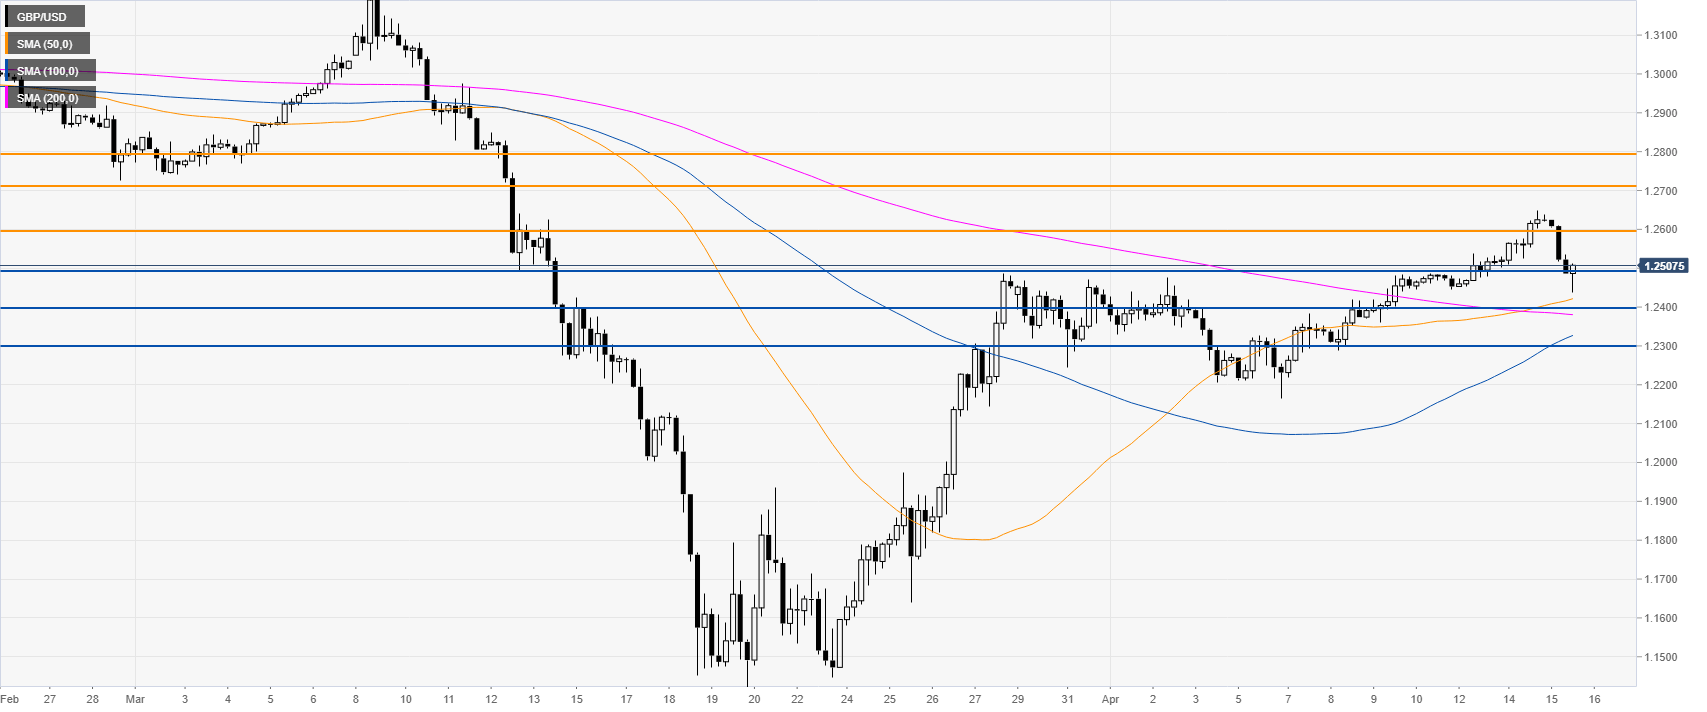
Resistance: 1.2600, 1.2700, 1.2800
Support: 1.2500, 1.2400, 1.2300
Additional key levels
