- GBP/USD is pulling back down to the 1.2500 figure.
- However, the bullish recovery from mid-March remains intact.
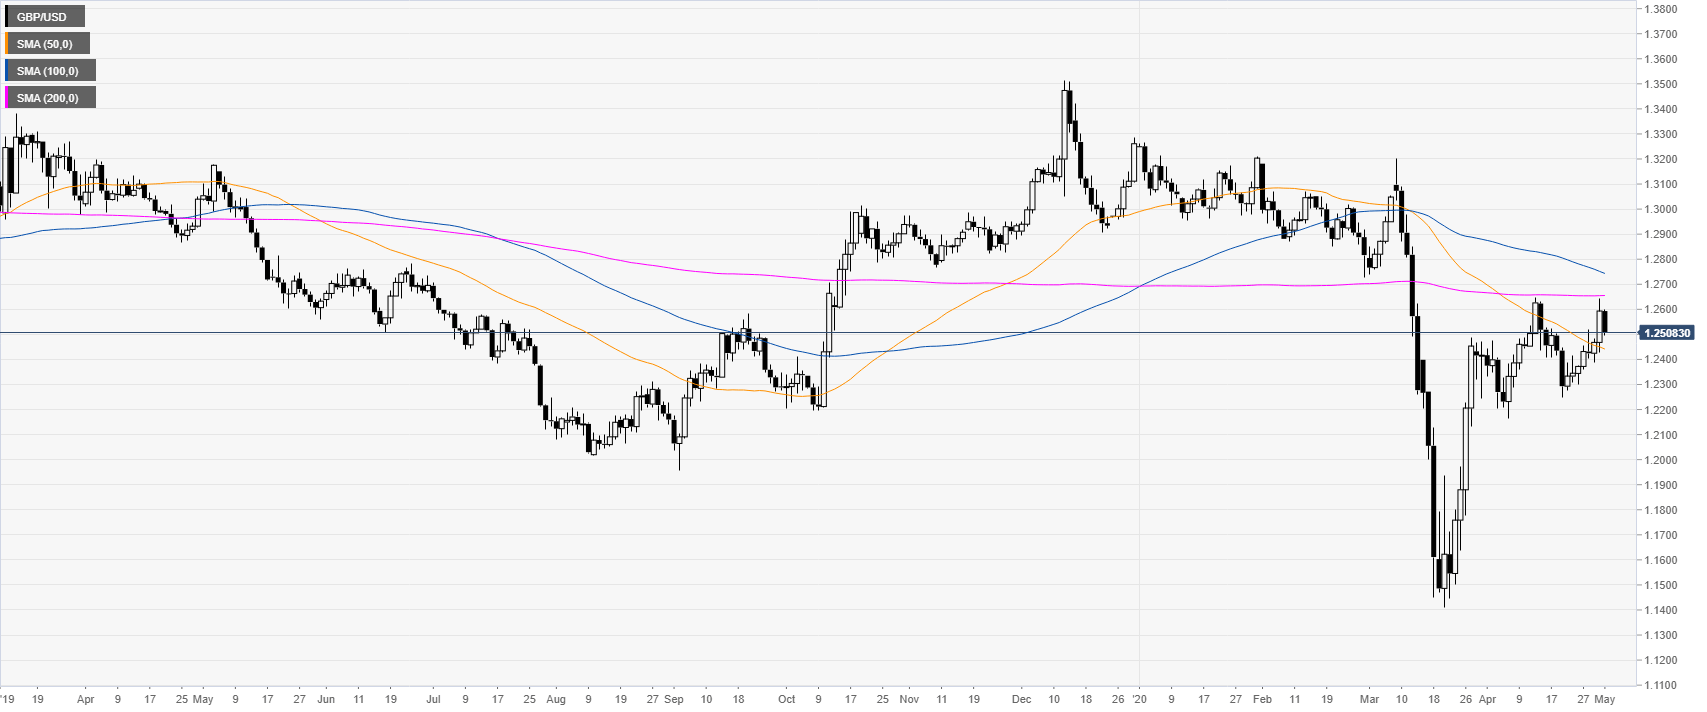
GBP/USD daily chart
The bullish recovery from mid-March stays intact as the spot is trading above its 50 SMA on the daily chart but just below the 200 SMA.
GBP/USD four-hour chart
GBP/USD found some resistance near 1.2600 and is retracing down to the 1.2500 figure this Friday. The spot is trading above the main SMAs confirming the bullish view in the medium-term. It is unclear if the pullback will extend further or if buyers are already ready to step back in. Next week if bears break 1.2500 it can indicate a deeper pullback while a bounce from current levels would leave the bullish bias intact with a potential retest of the 1.2600 figure on the cards.
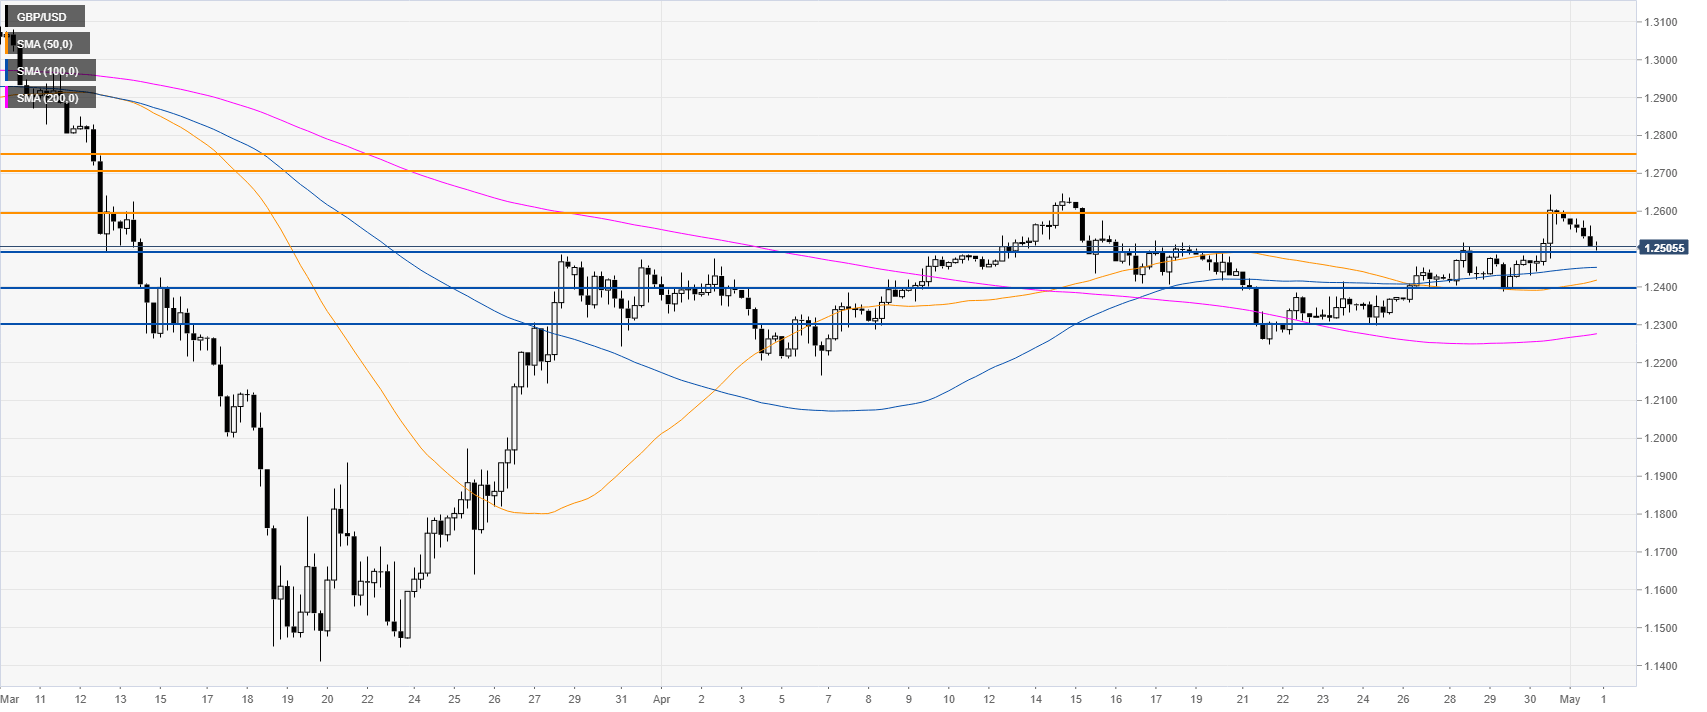
Resistance: 1.2600, 1.2700, 1.2750
Support: 1.2500, 1.2400, 1.2300
Additional key levels
