- GBP/USD is starting the week quietly while holding onto gains.
- The level to beat for bulls is the 1.200 level.
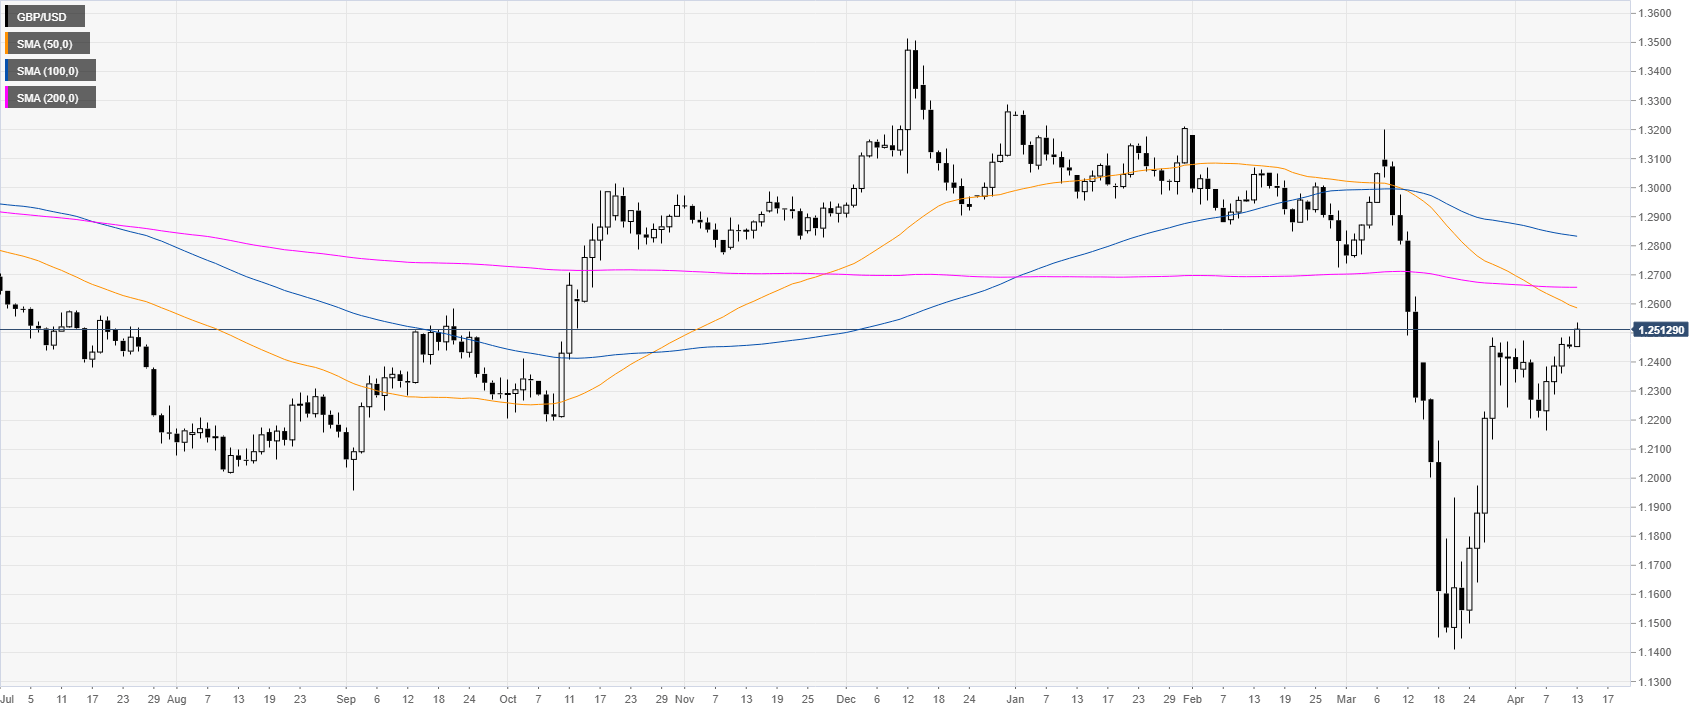
GBP/USD daily chart
After dropping to 1985 lows in March, GBP/USD is bouncing sharply while the quote remains below the main simple moving averages (SMAs) on the daily chart. The cable is also trading in one-month highs near the 1.2500 figure.
GBP/USD four-hour chart
Cable is trading above its main SMAs on the four-hour chart suggesting bullish momentum in the medium-term. Bulls would be on the lookout for a continuation up and a break beyond the 1.2600 figure en route towards the 1.2700 and 1.2800 levels. Conversely, support can be expected near the 1.2500, 1.2400 and 1.2300 figures on any pullback down.
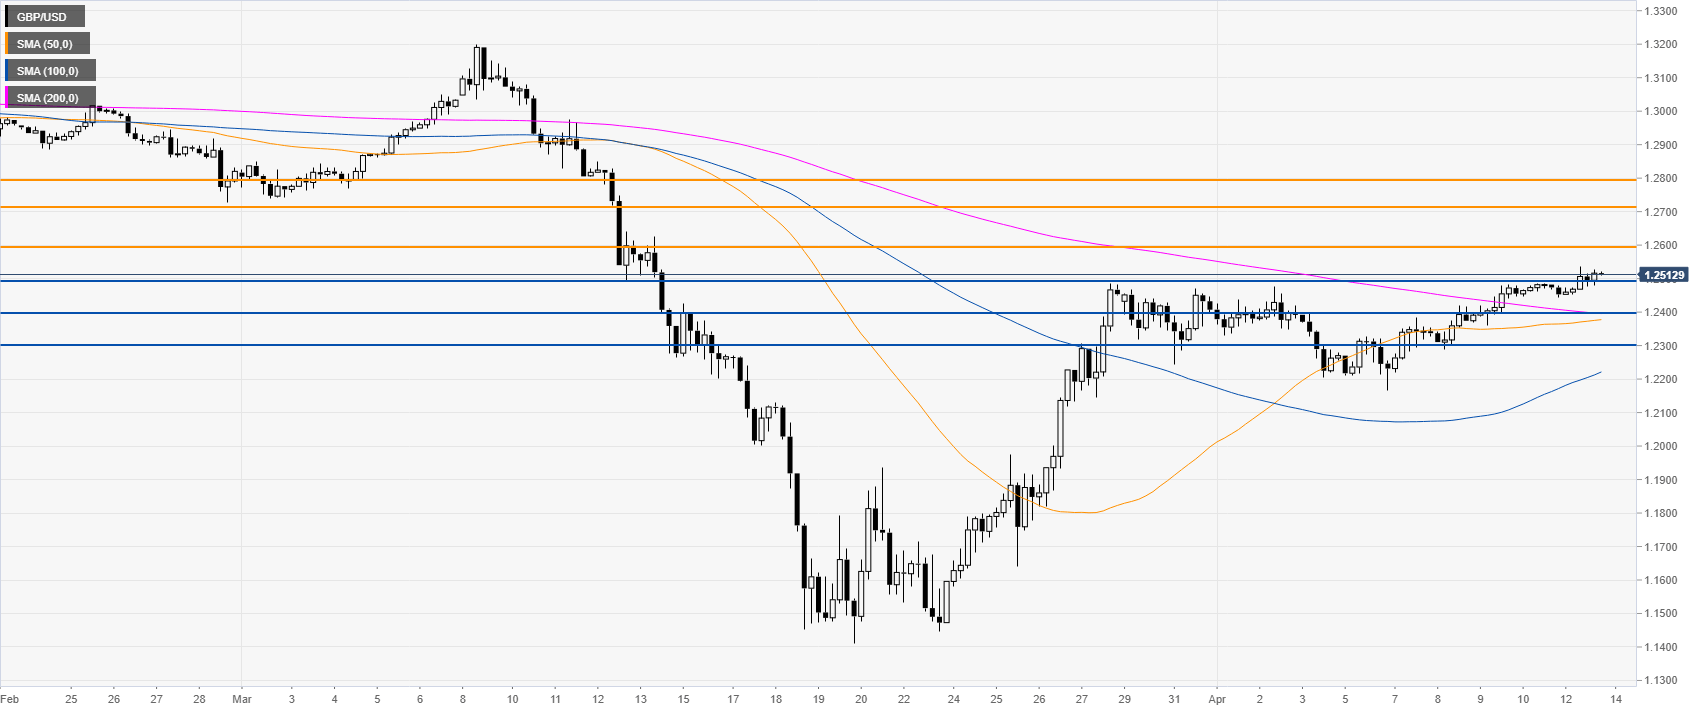
Resistance: 1.2500, 1.2600, 1.2800
Support: 1.2400, 1.2300, 1.2200
Additional key levels
