- GBP/USD is trading off 6-week lows on the third day of the week.
- The level to beat for sellers is the 1.2200 figure.
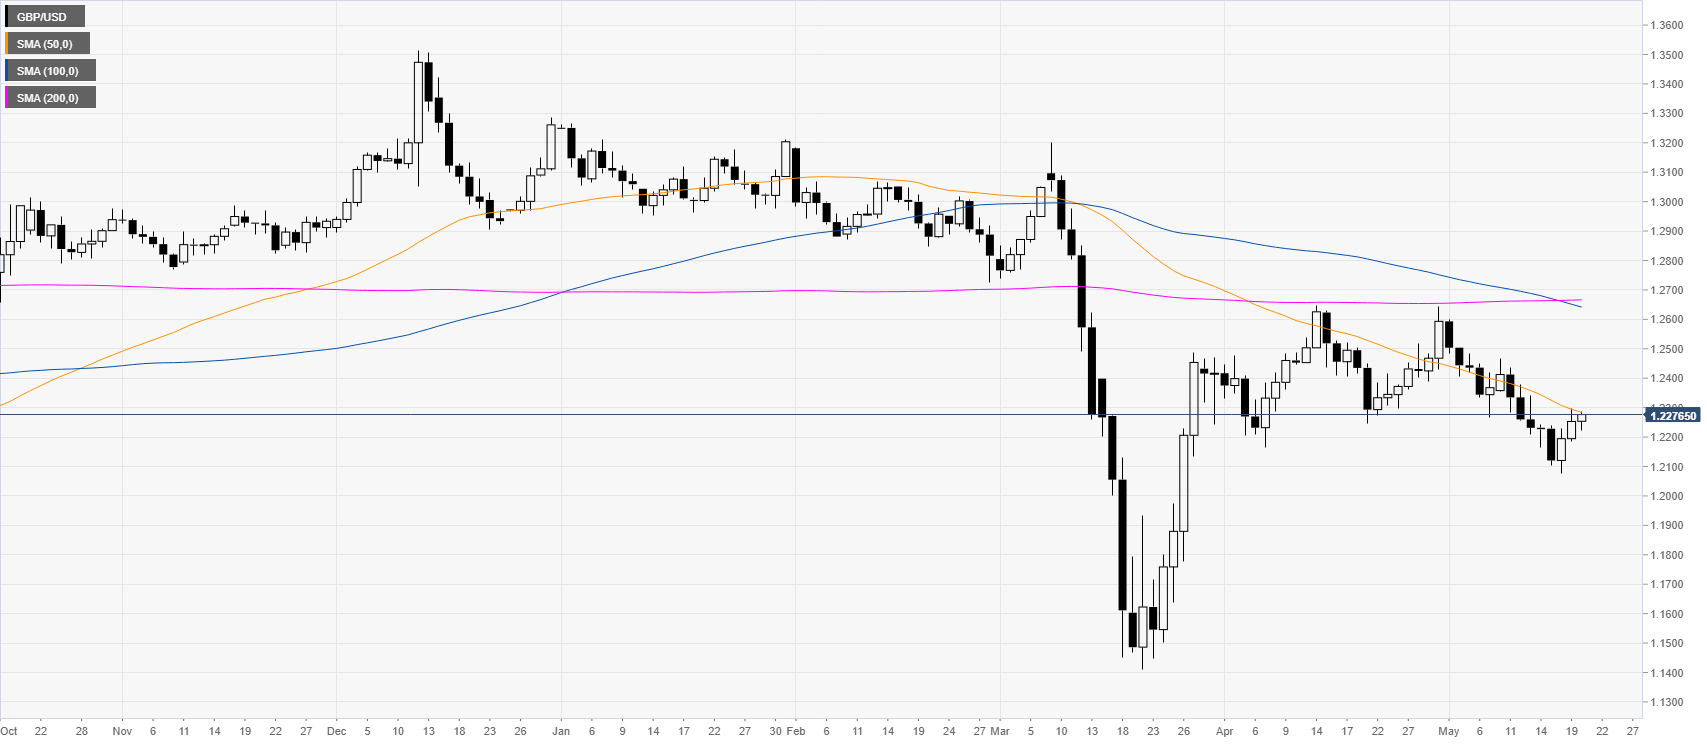
GBP/USD daily chart
GBP/USD is trading below the main SMAs on the daily chart suggesting a bearish bias as the market is rebounding mildly from 6-week lows.
GBP/USD four-hour chart
GBP/USD is having a reaction up although the spot is still trading below the 100 and 200 SMAs on the four-hour chart. The market is currently capped by the 1.2300 figure and the 50 SMA. Since the overall trend is down, bears can come back soon and try to drive prices below the 1.2200 level en route towards the 1.2100 level. On the other hand, a clear break beyond 1.2300 can yield further but limited advances. Resistances can be seen near 1.2400 and 1.2500 levels.
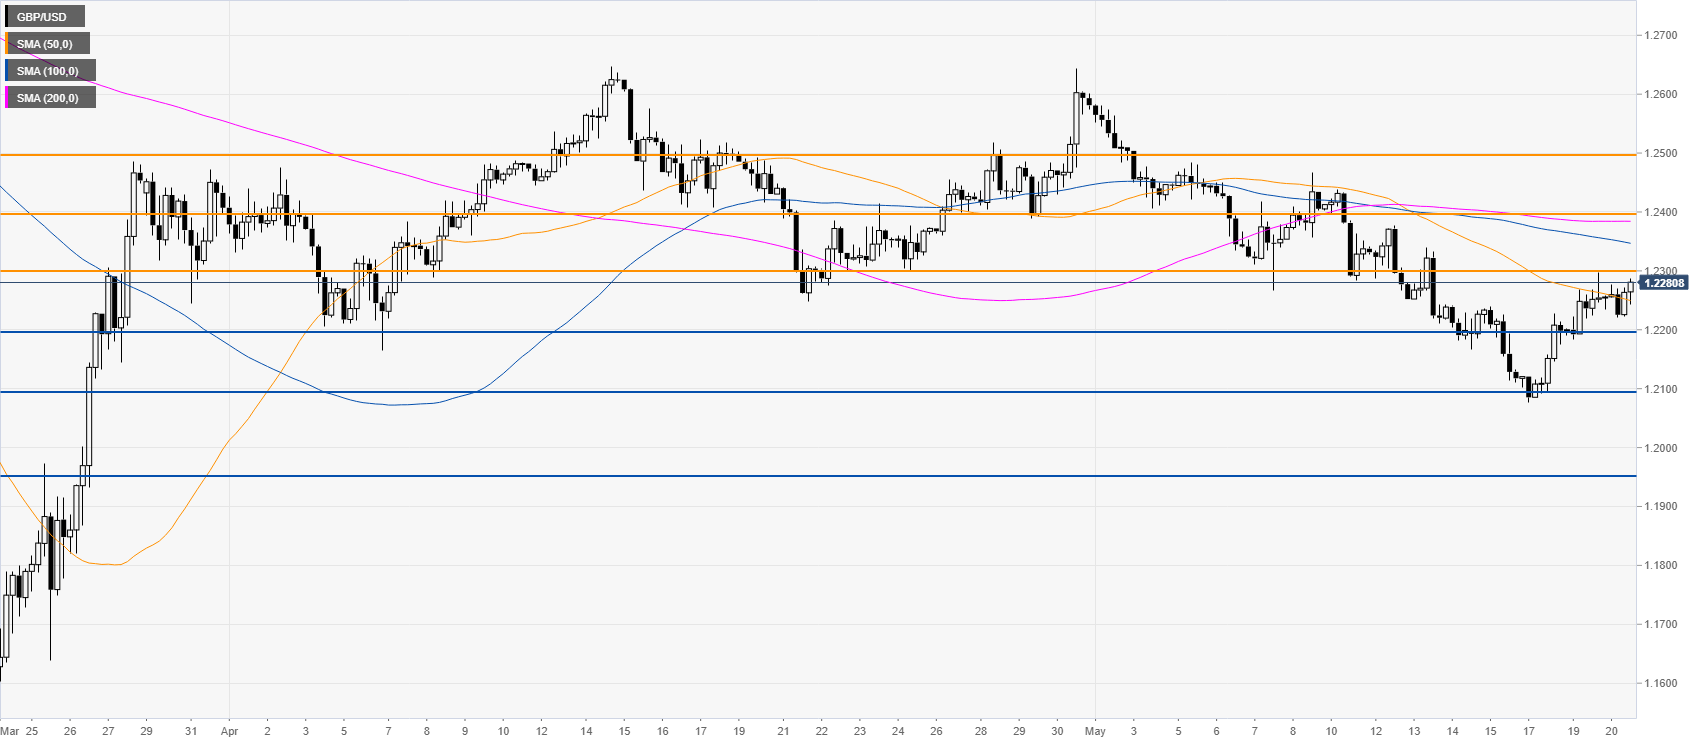
Resistance: 1.2300, 1.2400, 1.2500
Support: 1.2200, 1.2100, 1.1955
Additional key levels
