- GBP/USD holds onto recovery gains.
- 200-HMA, 61.8% Fibonacci retracement add to the resistances.
- The weekly support line restricts the immediate downside.
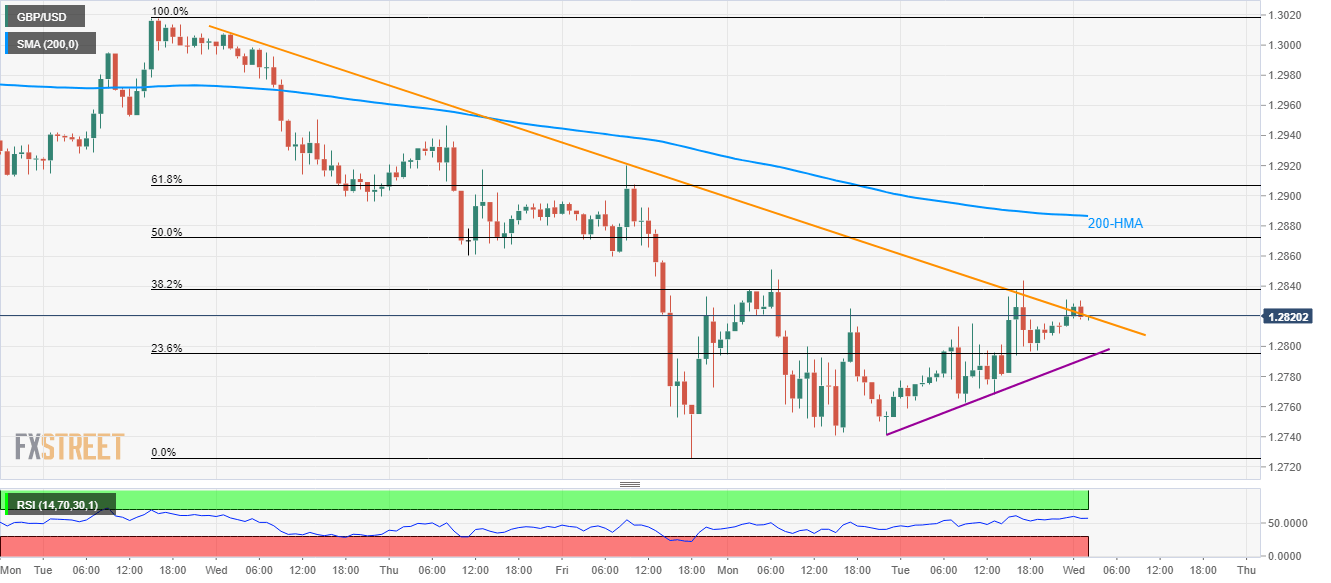
Following its recovery gains from Tuesday, GBP/USD probes a short-term resistance while taking the bids near 1.2820, up 0.08%, during early Wednesday.
Unless registering a sustained break beyond 1.2820, the Cable prices are less likely to take aim at a 200-Hour Moving Average (HMA) level of 1.2887.
Also adding to the upside barriers is 61.8% Fibonacci retracement of February25-28 declines, at 1.2907 now.
Meanwhile, an ascending trend line from Monday, near 1.2790, acts as the immediate support to watch during the pair’s fresh declines.
In a case where bears dominate below 1.2790, February month low near 1.2725 will be in the spotlight.
GBP/USD hourly chart
Trend: Further recovery expected
