- GBP/USD extends recovery gains from 1.3020 while snapping a two-day losing streak.
- Bearish MACD, one-week-old faling trend line doubts the pair’s further upside.
- 21-day EMA, a six-week-old support line add to the downside support.
GBP/USD recovers from 10-day EMA while trading near 1.3057, up 0.18% on a day, during the early Thursday’s Asian session. The Cable’s latest bounce ignores bearish MACD signals while aiming for a short-term resistance line.
However, the pair’s further upside beyond the said trend line resistance, at 1.3100 now, will need a strong push before attacking the monthly top around 1.3185 and March month’s peak surrounding 1.3200.
In a case where the bulls dominate past-1.3200, December 31, 2019 high close to 1.3285 can return to the chart.
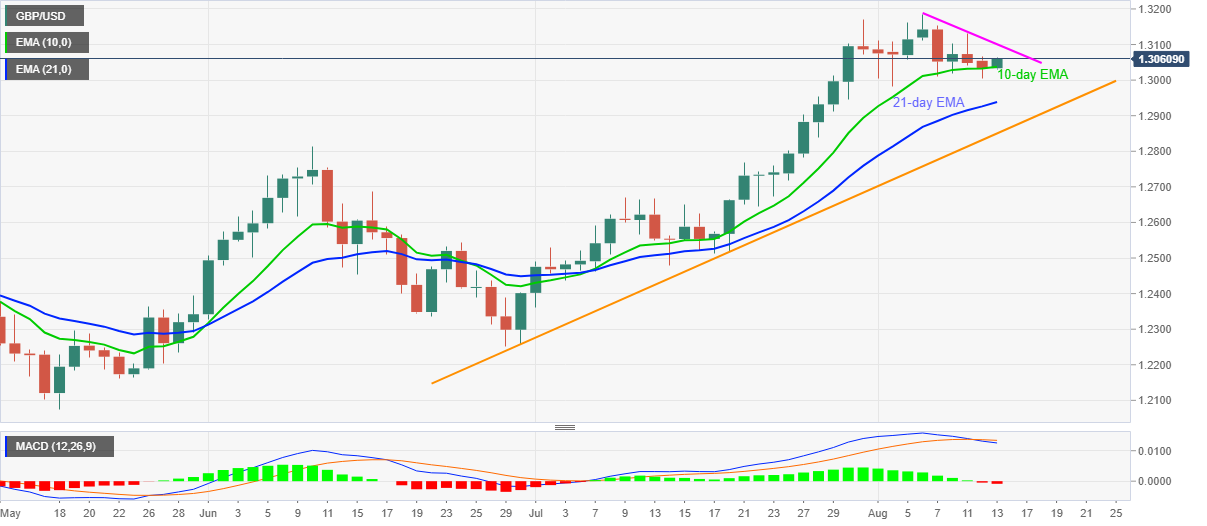
Meanwhile, a downside break of 10-day EMA level of 1.3035 won’t call the bears immediately as 21-day EMA and an ascending trend line from June 30, respectively around 1.2935 and 1.2850, can still trigger the pair’s bounce.
GBP/USD daily chart
Trend: Bullish
