- GBP/USD continues to show some resilience near an important confluence support.
- Neutral technical indicators on hourly/daily charts warrant some caution for traders.
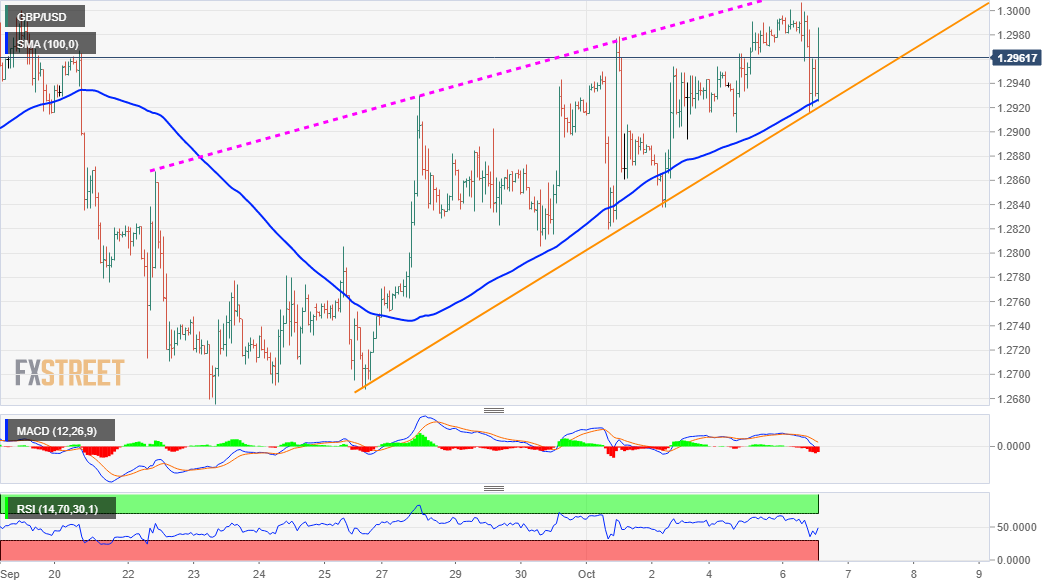
The GBP/USD pair seesawed between tepid gains/minor losses through the early North American session and was last seen trading in the neutral territory, comfortably above mid-1.2900s. The intraday downtick once again showed some resilience near an important confluence support, comprising of 100-hour SMA and near two-week-old ascending trend-line.
Meanwhile, technical indicators on the daily chart – though have recovered from the negative territory – are yet to confirm a bullish bias. Moreover, oscillators on the 1-hourly chart have been struggling to gain any meaningful traction, warranting some caution for bullish traders and positioning for any meaningful positive move.
Hence, it will be prudent to wait for some strong follow-through buying beyond the key 1.3000 psychological mark, above which the GBP/USD pair is likely to accelerate the momentum towards the 1.3065-70 resistance zone. Bulls might then push the pair further beyond 1.3100, towards testing the next hurdle near the 1.3170-75 zone.
On the flip side, the 1.2920-15 confluence region might continue to protect the immediate downside. Failure to defend the mentioned support will be seen as a fresh trigger for bullish traders and drag the GBP/USD pair further towards the 1.2865-60 support area. Any subsequent weakness is more likely to find decent support near the 1.2800 mark.
GBP/USD 1-hourly chart
Technical levels to watch
