- GBP/USD rises to the fresh high since May 2018.
- Key trend line hurdle from March 2020 probes the bulls.
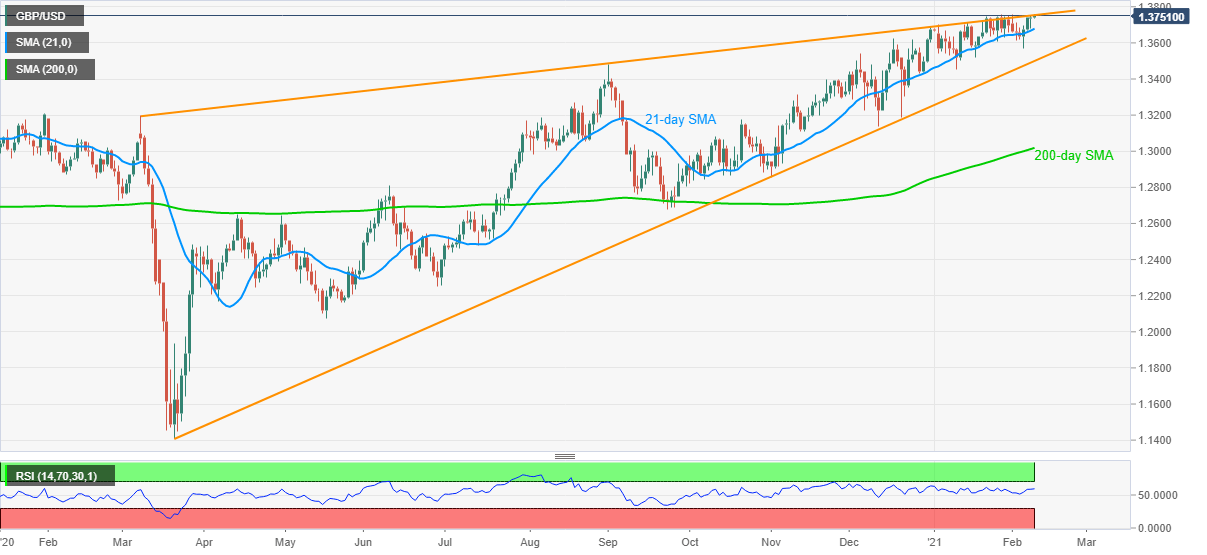
- 21-day SMA offers immediate support inside 11-month-old ascending triangle.
Following its recent uptick to 1.3760, the fresh high since May 2018, GBP/USD eases to 1.3752 during Tuesday’s Asian trading session.
While normal RSI conditions and sustained trading beyond 21-day SMA favor the cable bulls, the resistance line of a rising triangle formation established since March 2020 challenge the immediate upside.
Hence, GBP/USD buyers targeting the 1.3800 round-figure seem to wait for a daily closing beyond the key resistance line, currently around 1.3750.
Following that, the early April 2018 low near 1.3965 and the 1.4000 round-figure will gain the market’s attention.
Alternatively, 21-day SMA and support line of the stated triangle, respectively around 1.3680 and 1.3500, become the key for GBP/USD traders.
Should the quote drops below 1.3500 on a daily closing, a downward trajectory towards the 200-day SMA level of 1.3018 can’t be ruled out.
GBP/USD daily chart
Trend: Pullback expected
