- GBP/USD rises to a fresh high since May 2018.
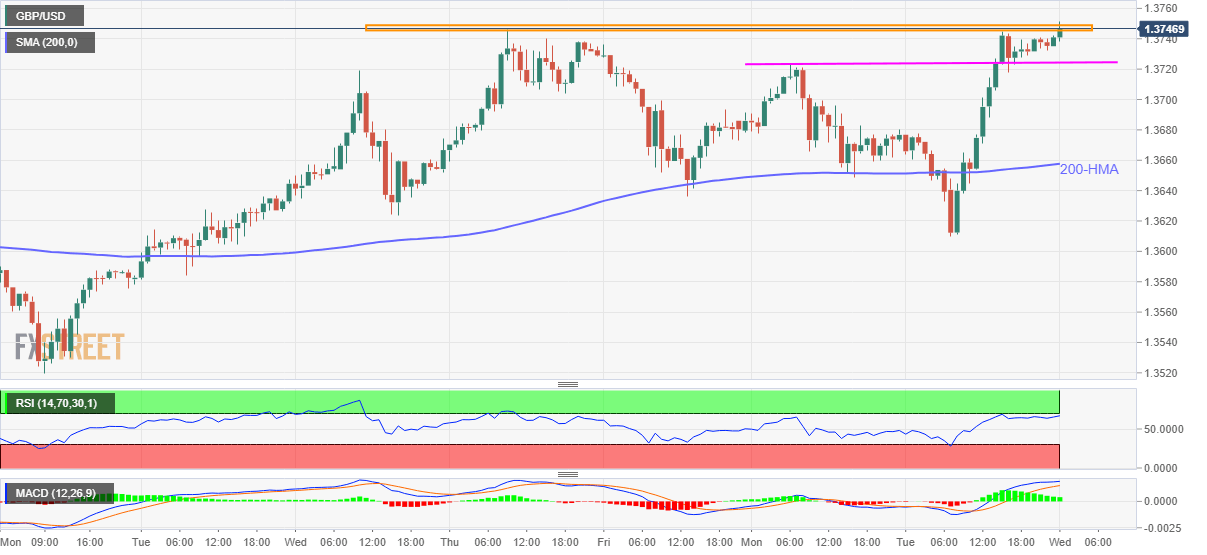
- RSI conditions, multiple pullbacks from immediate horizontal resistance test bulls despite the latest uptick.
- Monday’s top, 200-HMA challenge bears’ entry before the weekly bottom.
GBP/USD takes the bids near the yearly top, also the highest since May 2018, around 1.3750 amid Wednesday’s Asian trading session. In doing so, the cable marks an uptick beyond the one-week-old horizontal resistance.
Although clearance of short-term upside hurdle and bullish MACD suggests further upside of the quote, nearly overbought RSI conditions may push the GBP/USD buyers to wait for a clear break of 1.3750 before taking fresh long positions.
Following that, May 2018 peak surrounding 1.3770 can also challenge the upside momentum before challenging the late-April 2018 low near 1.3920.
Meanwhile, Monday’s low and 200-HMA, respectively around 1.3725 and 1.3655, can restrict the quote’s short-term downside ahead of the weekly low close to 1.3610.
During the GBP/USD weakness past-1.3610, the sellers can warrant a decisive break of the 1.3600 round-figure before targeting the 1.3520 support marked on January 18.
To sum up, the GBP/USD bulls are likely to catch a breather but the bullish trend remains intact unless the quote drops below 1.3520.
GBP/USD hourly chart
Trend: Pullback expected
