- GBP/USD keeps it under 50-day SMA, near to a bullish chart formation’s support.
- 61.8% of Fibonacci retracement can offer intermediate resistance.
- November 2019 lows on the bears’ radar.
GBP/USD stays mostly unchanged while taking rounds to 1.2910 during early Thursday. In doing so, the pair remains inside falling wedge formation, below 50-day SMA, while targeting the support line of the pattern.
Considering the bearish MACD and the pairs’ sustained weakness, the Cable is likely to defy the bullish formation by a decline below the 1.2870 immediate support.
Following that, lows marked during November 2019 around 1.2820 and 1.2770 will gain the market’s attention.
On the upside, 50-day SMA offers the immediate resistance near 1.3030 whereas 61.8% Fibonacci retracement of the pair’s November-December 2019 upside, at 1.3055, can please bulls afterward.
In a case where GBP/USD prices manage to rise past-1.3055, a confluence of 50% Fibonacci retracement and the pattern’s resistance near 1.3140/45 will be the key as an upside break of which can propel the quote towards 1.3300 area.
GBP/USD daily chart
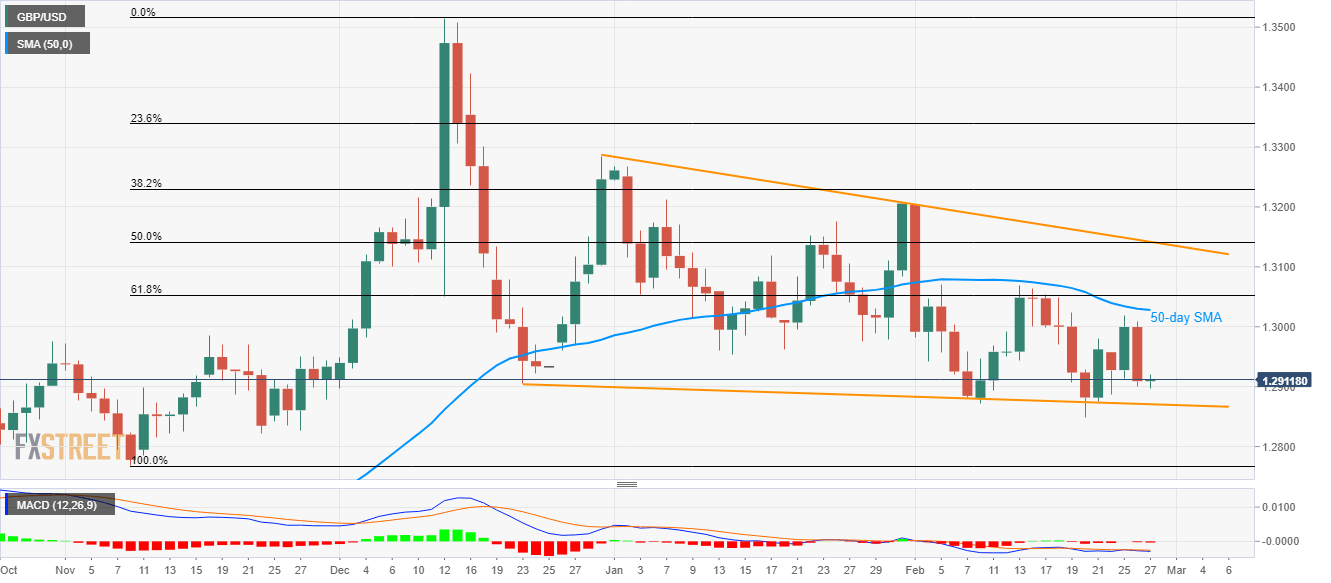
Trend: Bearish
