- GBP/USD confirmed a falling wedge breakout on the daily chart last Friday.
- Strong resistance at 1.3850 challenges the bullish commitments.
- RSI has turned bearish on Easter Monday, what’s in store?
GBP/USD is holding onto Friday’s trading range below 1.3850, as the US dollar keeps its recovery mode intact after a bit beat on the US Nonfarm Payrolls last Friday.
The cable is likely to take cues from the dollar dynamics and broader market sentiment, as trading is expected to be light, as the most major European markets remain closed on account of Easter Monday.
At the press time, the cable trades neutral on the day, around 1.3825, as it continues to face strong selling pressure around 1.3845-50 region. That zone is the confluence of the horizontal 21 and 50-daily moving averages (DMA).
It’s worth noting that the spot confirmed a falling wedge breakout on the daily chart after the price closed Friday above the falling trendline resistance at 1.3824.
Buyers need acceptance above the 1.3850 key upside barrier, in order to extend the break higher towards 1.3900.
Further up, the March 19 high at 1.3959 could be challenged.
GBP/USD: Daily chart
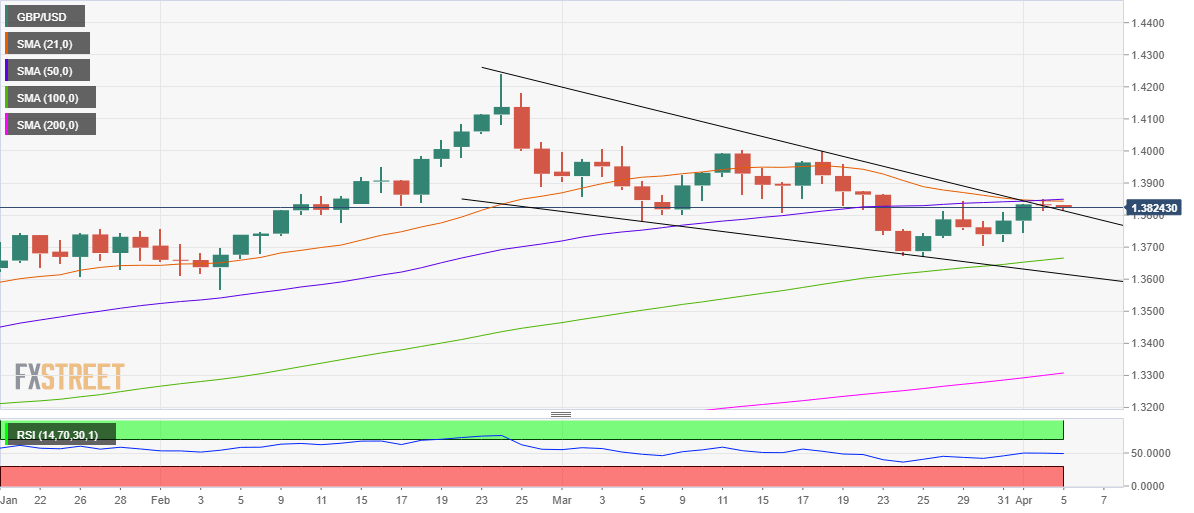
However, with the relative strength index (RSI) having returned to the bearish territory, GBP/USD is envisioned to breach the 1.3800 support should Friday’s low of 1.3813 cave-in.
The next crucial support around 1.3750, Thursday’s low, could limit the declines. The 100-DMA at 1.3666 is likely to offer strong support to the GBP bulls.
GBP/USD: Additional levels
