- GBP/USD witnessed follow-through selling for the second consecutive session on Wednesday.
- The set-up supports prospects for the emergence of some dip-buying around the 1.3900 mark.
The GBP/USD pair extended the previous day’s retracement slide from multi-week tops – levels beyond the key 1.4000 psychological mark – and edged lower for the second straight session on Wednesday. The pair maintained its offered tone through the mid-European session and was last seen hovering near daily lows, around the $1.3920 region.
The British pound was weighed down by Wednesday’s release of slightly lower than anticipated UK consumer inflation figures. On the other hand, a modest pickup in the US Treasury bond yields allowed the US dollar to build on the overnight bounce from multi-week lows. This, in turn, exerted some downward pressure on the GBP/USD pair.
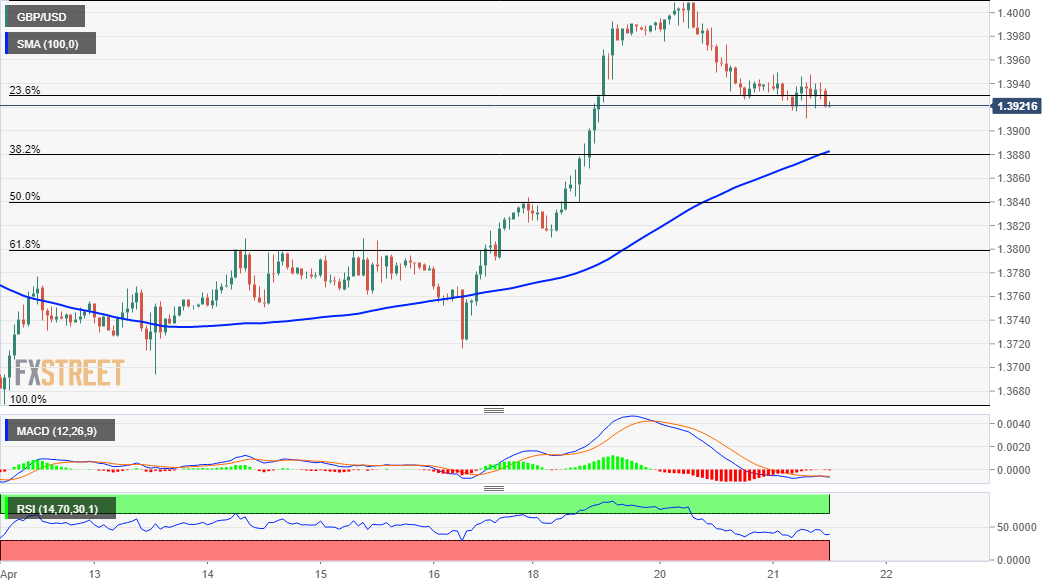
Looking at the technical picture, the intraday price move has been confined in a range around the 23.6% Fibonacci level of the 1.3669-1.4009 latest leg up. With technical indicators on the 1-hour chart holding in the bearish territory, any further selling has the potential to drag the GBP/USD pair further towards the 1.3885-80 confluence support.
The latter coincides with the 38.2% Fibo. level and the 100-hour SMA. This should now act as a key pivotal point for traders and help determine the near-term trajectory for the GBP/USD pair.
Meanwhile, oscillators on 4-hour/daily charts – though have eased from higher levels – maintained their bullish bias and support prospects for the emergence of some dip-buying at lower levels. Hence, it will be prudent to wait for sustained weakness below the mentioned confluence region before confirming that the GBP/USD pair has topped out.
The next relevant target on the downside is pegged near the 50% Fibo. level, around the 1.3840 region. Bears could eventually aim to test the next relevant support near the 1.3800 mark, or the 61.8% Fibo. level, which if broken decisively will negate any near-term positive bias.
On the flip side, the intraday swing highs, around the 1.3950 region now seems to act as immediate strong resistance. A convincing breakthrough should pave the way for a move back towards reclaiming the 1.4000 mark. Some follow-through buying will be seen as a fresh trigger for bullish traders and pave the way for additional near-term gains.
GBP/USD 1-hour chart
Technical levels to watch
