- GBP/USD remained under some heavy selling pressure for the second straight day.
- The set-up favours bearish traders and supports prospects for further weakness.
- Slightly oversold RSI on the 1-hourly chart warrants some caution for bearish traders.
The GBP/USD pair witnessed some heavy selling for the second consecutive session on Monday and dived to four-day lows, around the 1.2835 region during the early European session.
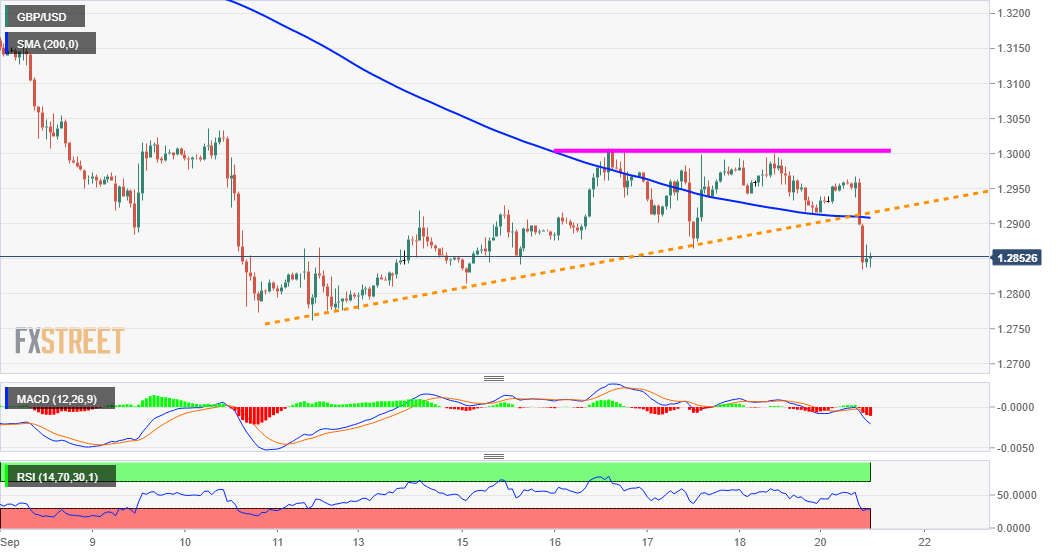
Given last week’s repeated failures near the key 1.3000 psychological mark, a sustained break below the 1.2910-1.2900 confluence support was seen as a key trigger for intraday bearish traders. The mentioned region comprised of 200-hour SMA and a short-term ascending trend-line support.
Bearish technical indicators on 4-hourly/daily charts support prospects for a further near-term depreciating move amid reports that the UK could be headed for another national lockdown. However, slightly oversold RSI (14) on the 1-hourly chart warrants some caution for bearish traders.
Nevertheless, the pair still seems vulnerable to extend the downfall further towards testing the 1.2800 round-figure mark. The downward momentum could further get extended and drag the pair back towards multi-week lows, around the 1.2765-60 region touched on September 11th.
On the flip side, any attempted recovery move might now confront a stiff resistance and remain capped near the 1.2900 confluence support breakpoint. That said, some follow-through buying might trigger some intraday short-covering move and pushed the pair back to the 1.2965-70 supply zone.
GBP/USD 1-hourly chart
Technical levels to watch
