- GBP/USD eases from intraday top while reversing pullback from 1.3045.
- Failures to confirm a bullish chart pattern highlights 1.3010/3000 support-confluence.
- A clear break beyond 1.3130 becomes necessary to recall the buyers.
GBP/USD drops to 1.3062, down 0.05% on a day, during Friday’s Asian session. The pair recently took a U-turn from the intraday top near 1.3075 while defying the previous recoveries from 1.3045. Even so, the pair stays inside a short-term descending triangle formation.
Despite the pair’s latest weakness, bullish MACD stops the bears’ entries unless the quote declines below 1.3010/3000 region comprising 100-bar SMA and the triangle’s support.
Following that, 1.2900 and July 28 low near 1.2838 can entertain sellers ahead of diverting them to July 21 top of 1.2767.
Meanwhile, the triangle’s resistance around 1.3085 offers an immediate upside barrier to the pair before the weekly top around 1.3130.
If bulls manage to dominate past-1.3130, the monthly high around 1.3185 and March month’s peak surrounding 1.3200 will regain market attention.
GBP/USD four-hour chart
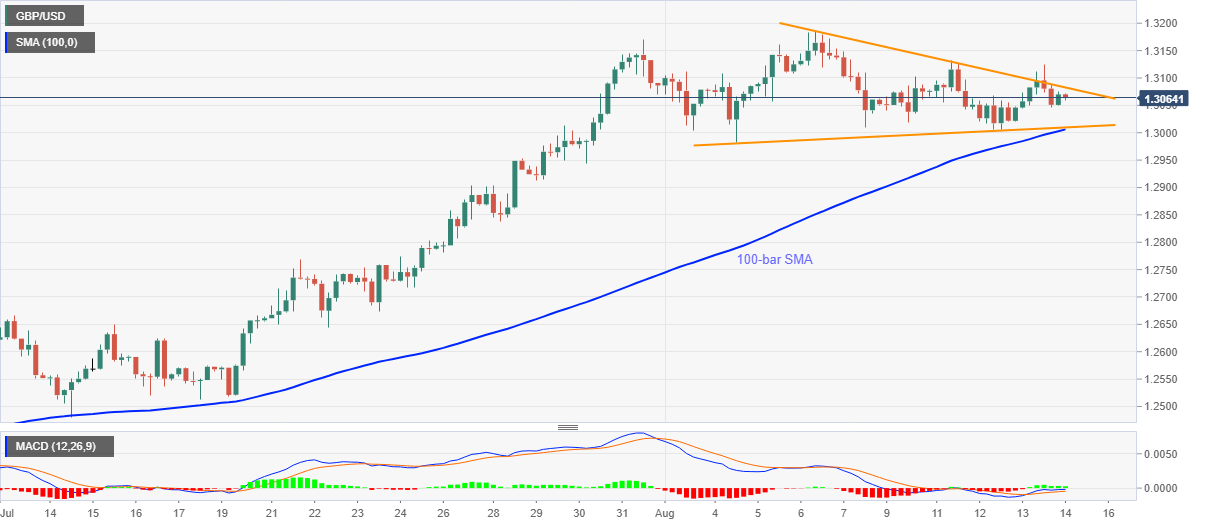
Trend: Sideways
