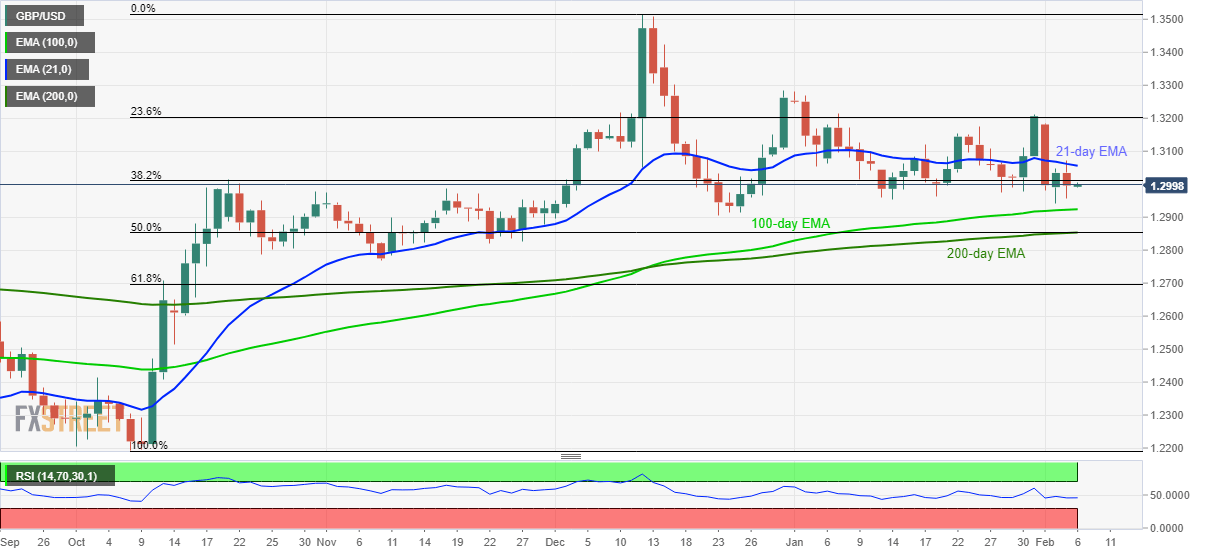
- GBP/USD remains under 21-day EMA, 38.2% Fibonacci retracement.
- A confluence of 200-day EMA, 50% Fibonacci retracement will be the key.
GBP/USD clings to 1.3000 during Thursday’s Asian session. The pair failed to extend its recovery beyond 21-day EMA the previous day, not to forget its current stand under 38.2% Fibonacci retracement of October-December upside.
With this, the quote is likely to remain under pressure towards a 100-day EMA level of 1.2925. However, pair’s further declines could challenge a support confluence around 1.2850 that includes 200-day EMA and 50% Fibonacci retracement.
In a case where the bears dominate below 1.2850, November 2019 low near 1.2770 will be on their radars.
On the upside break of the 21-day EMA level of 1.3055, short-term buyers could target 23.6% Fibonacci retracement, at 1.3200.
Also, the pair’s sustained rise beyond 1.3200 will take aim at December 31, 2019 top of 1.3285 prior to targeting the December month’s high of 1.3516.
GBP/USD daily chart
Trend: Pullback expected
