- GBP/USD nears the lowest since 1985 flashed the previous day.
- A short-term ascending triangle stops bears for a breath.
- An upside clearance can recall short-term buyers.
GBP/USD remains on the back foot near 1.1495 during the early Asian session on Thursday. The Cable earlier slumped to the lowest since 1985 while trimming more than 500 pips daily.
However, the following higher low formation portrayed an ascending triangle on the 30-minute chart.
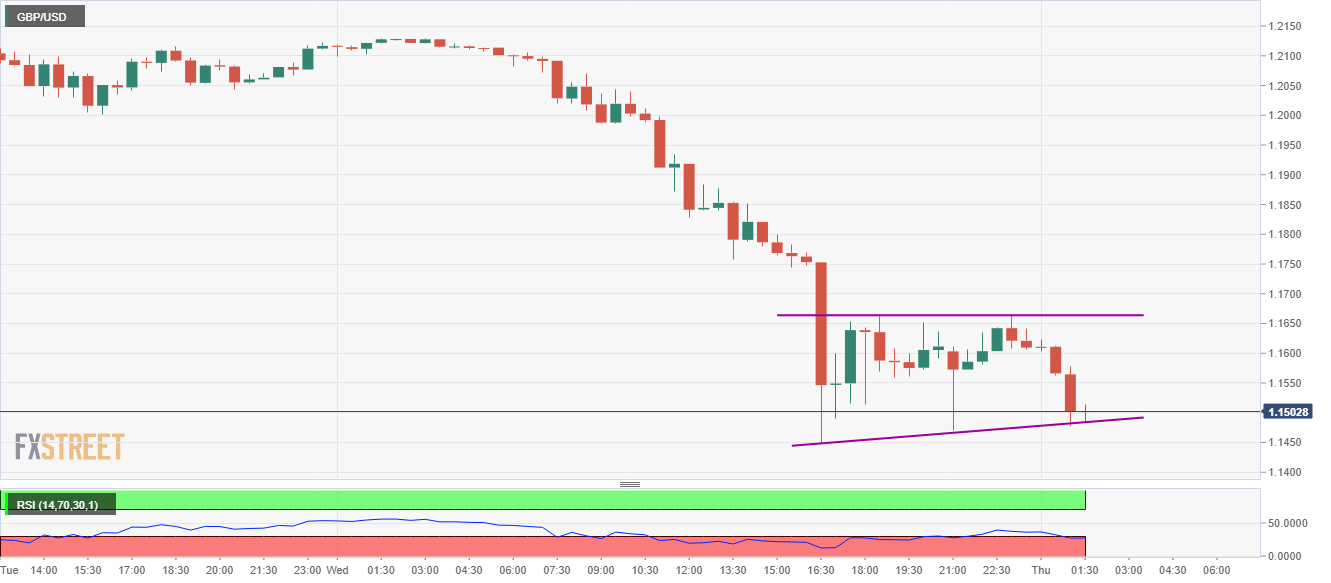
Sellers are waiting for fresh entries below the pattern’s support of 1.1485 to revisit the previous day’s low of 1.1450.
Though, oversold RSI indicates the chances of the pair’s pullback, which in turn could challenge the pattern’s resistance line of 1.1665.
Should there be a clear upside past-1.1665, the quote could extend the recovery gains to 1.1830 and 1.1900 ahead of targeting to regain 1.2000 mark.
GBP/USD 30-minute chart
Trend: Bearish
