- GBP/USD struggles to remain strong beyond 21-day SMA.
- 61.8% Fibonacci retracement, 200-day SMA guard immediate upside.
- 1.2130 holds the key to pair’s declines towards 1.2000 mark.
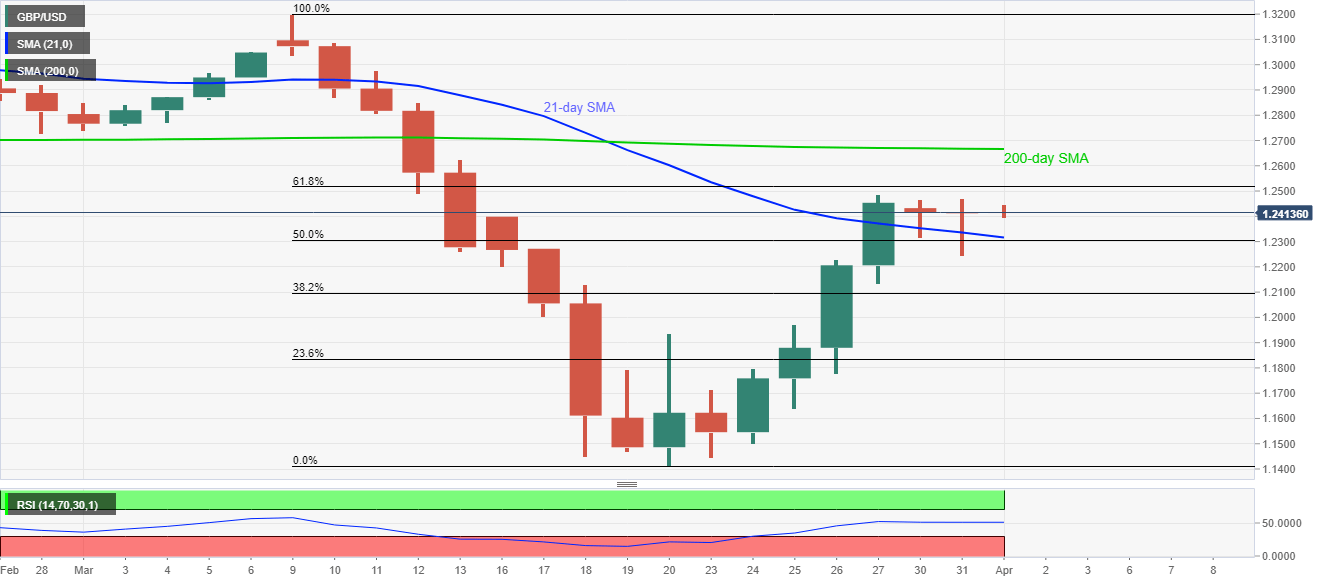
GBP/USD remains mildly changes to 1.2420 during Wednesday’s Asian session. That said, the pair struggles to carry its strength beyond 21-day SMA while staying below 61.8% Fibonacci retracement of March month declines and 200-day SMA.
Just ahead of the 61.8% Fibonacci retracement level of 1.2520, highs marked during late-March, around 1.2485/90, can act as the immediate resistance.
Further, a 200-day SMA level of 1.2665 and the early-March low near 1.2740 add to the upside barriers.
Alternatively, sellers will seek entry below the confluence of 21-day SMA and 50% Fibonacci retracement, near 1.2315/10.
In doing so, 1.2130 could be on their radars as it holds the gate for further weakness towards 1.2000.
GBP/USD daily chart
Trend: Sideways
