- GBP/USD drops from five-week high, slips below 61.8% Fibonacci retracement.
- 200-bar SMA acts as the key support, buyers will look for entry beyond two-month-old horizontal resistance.
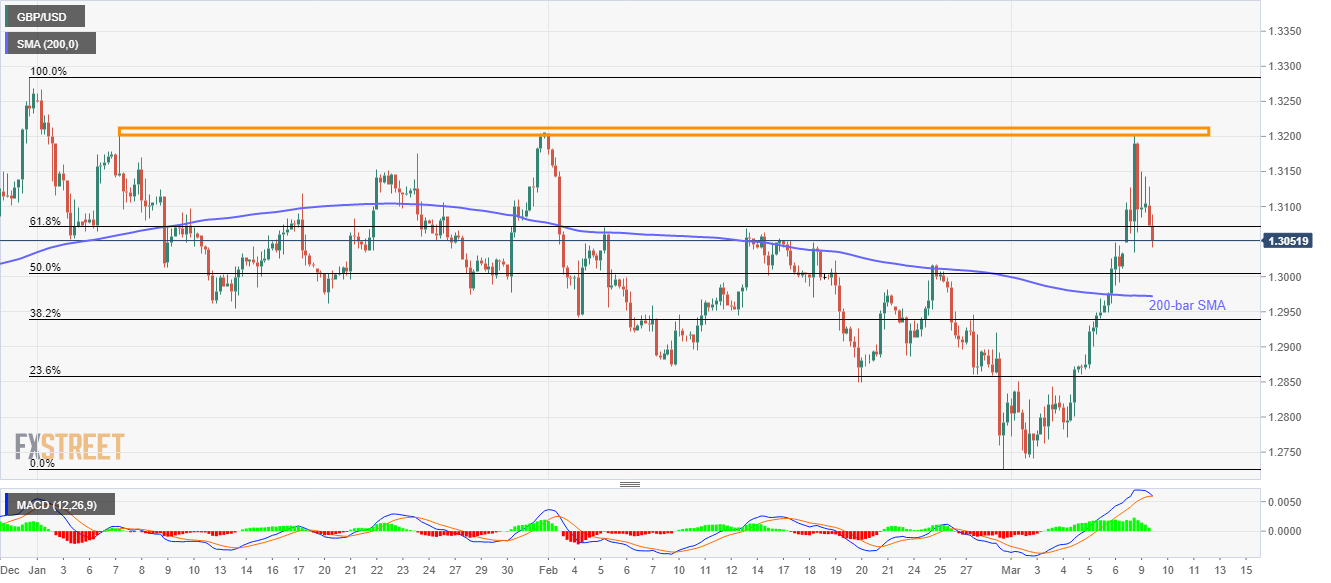
Following its pullback from the multi-day top, GBP/USD declines to 1.3055, down 0.54%, during the early Tuesday’s trading hours.
In doing so, the Cable slips below 61.8% Fibonacci retracement of its drop from December 31, 2019, to February 29, 2020.
As a result, sellers are now targeting the extended downside towards a 200-bar SMA level of 1.2975. Though, 50% Fibonacci retracement around 1.3000 could offer intermediate halt during the fall.
Alternatively, 1.3150 can question buyers following the bounce beyond 61.8% Fibonacci retracement level of 1.3070.
However, a horizontal area comprising highs marked from January 07, around 1.3200-3215 can keep limiting the pair’s run-up past-1.3150.
It’s worth mentioning that the MACD histogram is teasing bears on the four-hour (H4) chart and favors to the sellers.
GBP/USD four-hour chart
Trend: Further declines expected
