- GBP/USD holds onto latest recovery as bulls attack 50-SMA, upper line of the one-week-old symmetrical triangle.
- Momentum indicator suggests no movement but sustained trading beyond 200-SMA, the key Fibonacci retracement levels favor bulls.
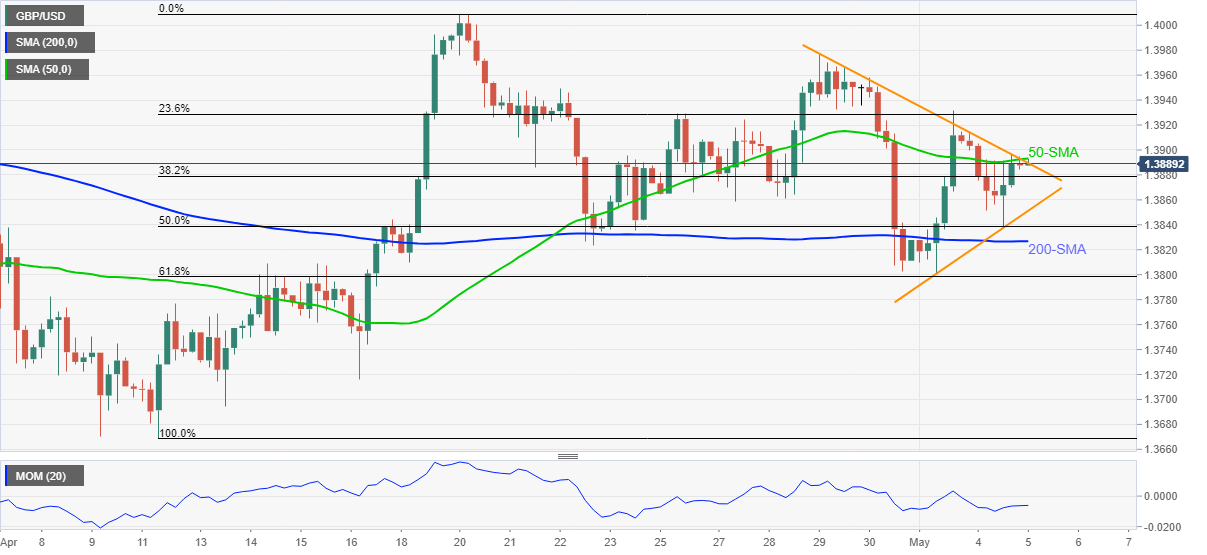
GBP/USD picks up bids around 1.3895, up 0.05% on a day, during Wednesday’s Asian session. In doing so, the cable keeps recent recovery moves to challenge the immediate upside hurdle, namely 50-SMA and short-term triangle resistance.
Although the Momentum line favors steady moves, the GBP/USD pair’s successful recovery from 200-SMA and 61.8% Fibonacci retracement of April 12-20 upside keep buyers hopeful.
However, the 1.3900 threshold adds to the upside barrier, in addition to the immediate 1.3895 key hurdle, before recalling the bulls targeting the 1.4000-4010 strong resistance area including the previous month’s top.
On the flip side, pullback moves need to break the stated triangle’s support line, around 1.3850, before directing GBP/USD sellers to 50% Fibonacci retracement level and 200-SMA, respectively near 1.3835 and 1.3825.
Should the pair remains pressured below 1.3825, 61.8% Fibonacci retracement will challenge the bears around 1.3800 psychological magnet.
GBP/USD four-hour chart
Trend: Further recovery expected
