- GBP/USD turns south after facing rejection at the rising wedge hurdle.
- The cable is on the verge of a downside break, as 50-SMA gets tested.
- RSI points south while teasing the central line.
GBP/USD is correcting sharply from three-year highs of 1.4248, now trading in the red below 1.4200, as the US dollar bears take a breather ahead of the critical ISM Manufacturing PMI.
Downbeat UK Final Manufacturing PMI also adds to the pain in the cable, as it showed a slowdown in manufacturing sector recovery in the Kingdom.
Additionally, renewed US dollar’s bullish momentum amid tapering talks adds to the downside pressure on the major. Meanwhile, the GBP bulls remain threatened by the concerns over a likely third covid wave, which dampens the optimism around the country’s successful vaccination campaign.
From a near-term technical perspective, the spot is testing the rising trendline support at 1.4191, with a four-hourly closing below that level likely to confirm a rising wedge breakdown.
The abovementioned level is critical, as the bullish 21-simple moving average (SMA) coincides.
Further south, the 50-SMA at 1.4170 could challenge the bearish commitments.
GBP/USD four-hour chart
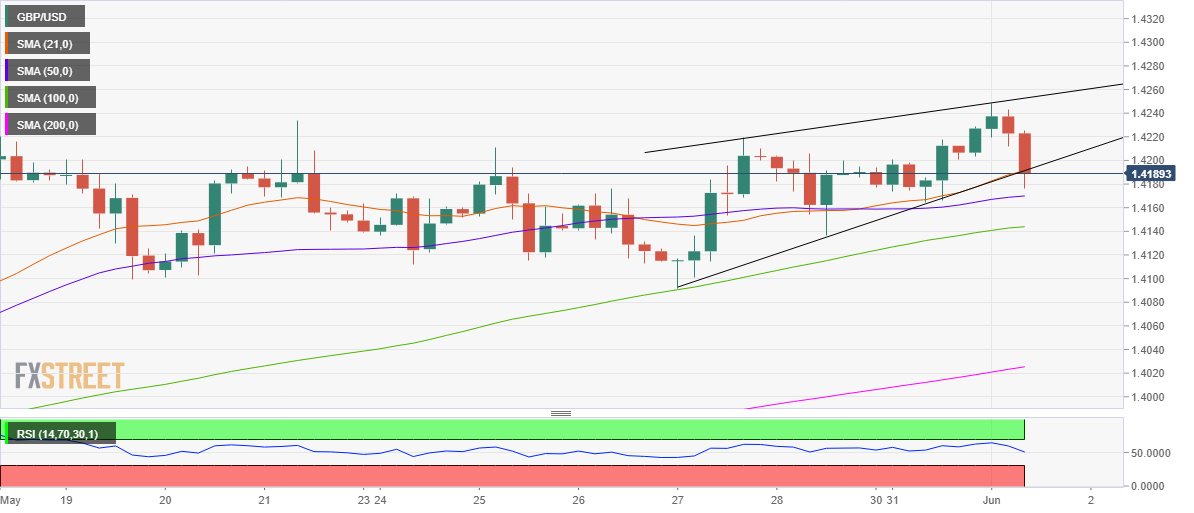
If the selling pressure intensifies, then a drop towards the 100-SMA at 1.4144 remains on the cards.
The Relative Strength Index (RSI) is pointing south while probing the central line, suggesting weakening bullish bias.
On the flip side, GBP bulls need to recapture the 1.4250 barrier for additional gains towards 1.4300.
GBP/USD additional levels to watch
