- GBP/USD fades upside momentum from 1.2928, bulls cling to 50-day EMA after three-day rise.
- MACD conditions push for another attempt to cross immediate resistance line.
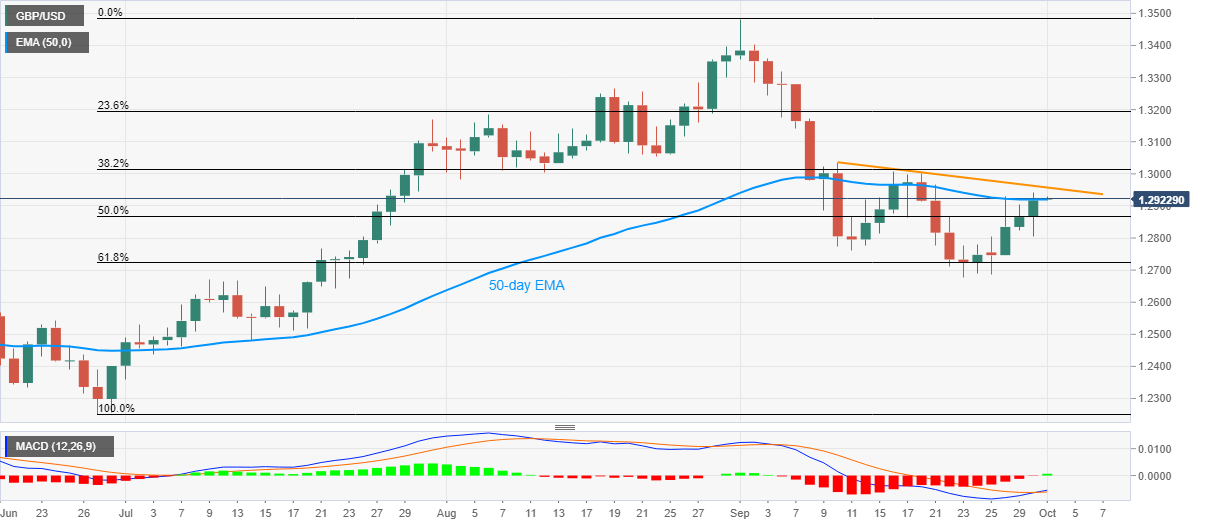
- 50% Fibonacci retracement offers nearby support before highlighting September low.
GBP/USD steps back to 1.2919 during the pre-Tokyo open Asian trading on Thursday. The Cable rose for three consecutive days by the end of September, before probing the 50-day EMA amid bullish MACD.
Considering the momentum strength, the quote is expected to attack the descending trend line from September 10, at 1.2957 now.
Though, any further upside by GBP/USD beyond 1.2957 will be probed by the 1.3000 psychological magnet.
Additionally, highs marked on September 16 and 10, respectively around 1.3010 and 1.3035, will also challenge the pair bulls.
Meanwhile, GBP/USD weakness below the 50-day EMA level of 1.2920 can aim for a 50% Fibonacci retracement of June-September upside, at 1.2868.
In a case where the Pound sellers dominate past-1.2868, September 11 low around 1.2760 will precede 61.8% of Fibonacci retracement and the previous month’s low, near 1.2720 and 1.2675 respectively, to pop-up on the radar.
GBP/USD daily chart
Trend: Pullback expected
