- GBP/USD is trapped between weekly support and resistance.
- Bears may emerge to test below the hourly support once again.
The price of GBP/USD is proving to be stubbornly stuck between the support and resistance on the longer-term time frames which is leaving swing traders on the sidelines.
There are higher risk plays on the lower time frames following a restest of a daily support structure which resulted in a rally. This leaves a bearish prospect on the hourly time frame on a break of hourly support.
GBP/USD weekly chart
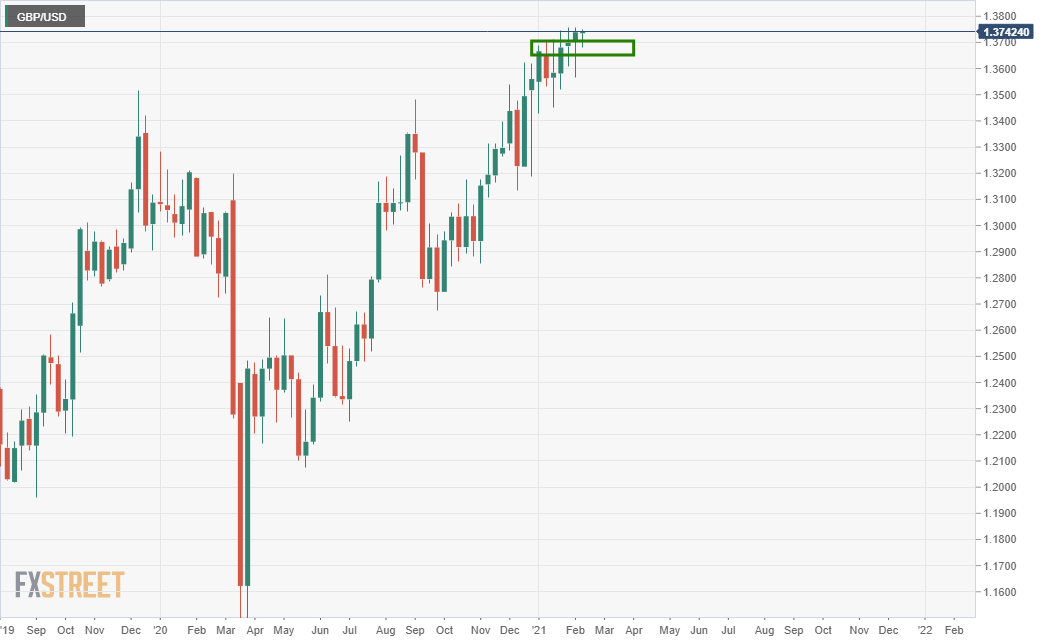
The price is holding above weekly support.
Daily chart
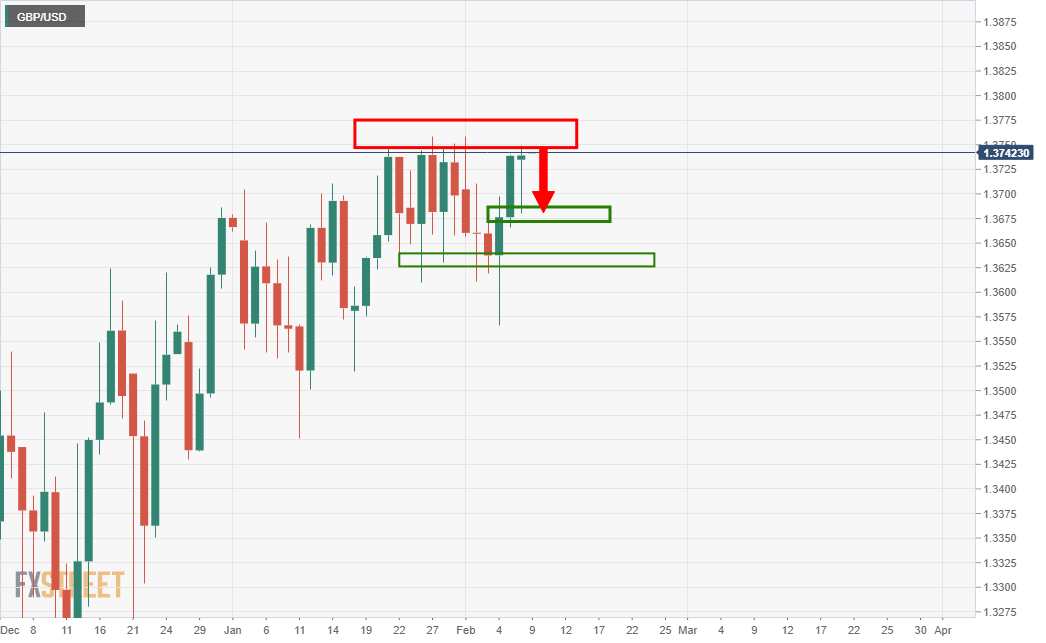
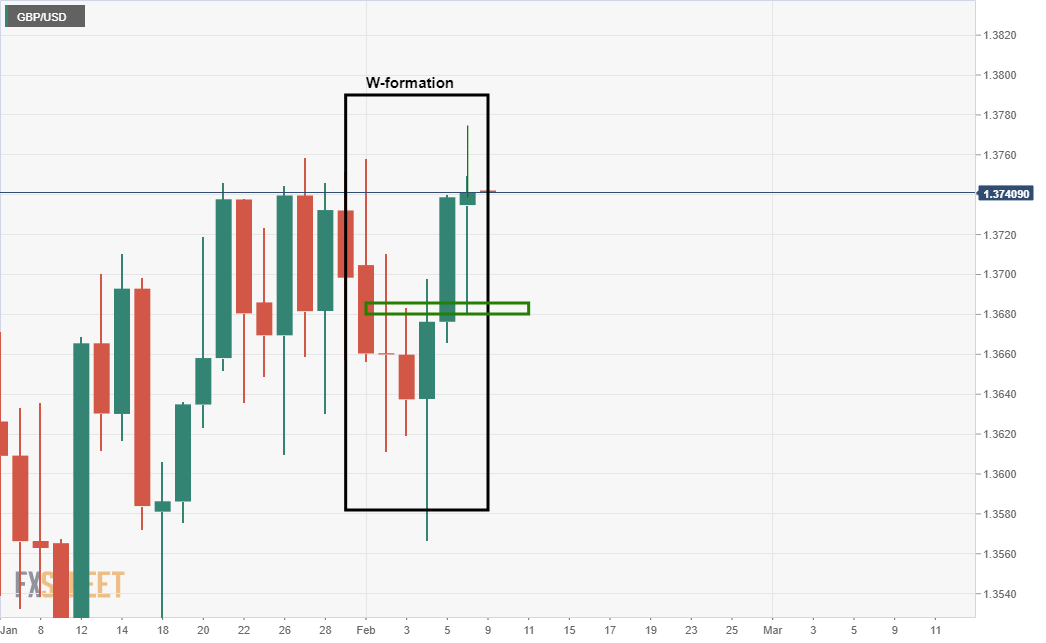
The market has painted a W-formation on the charts which would be expected to draw in the bears to test the neckline of the formation.
Hourly charts
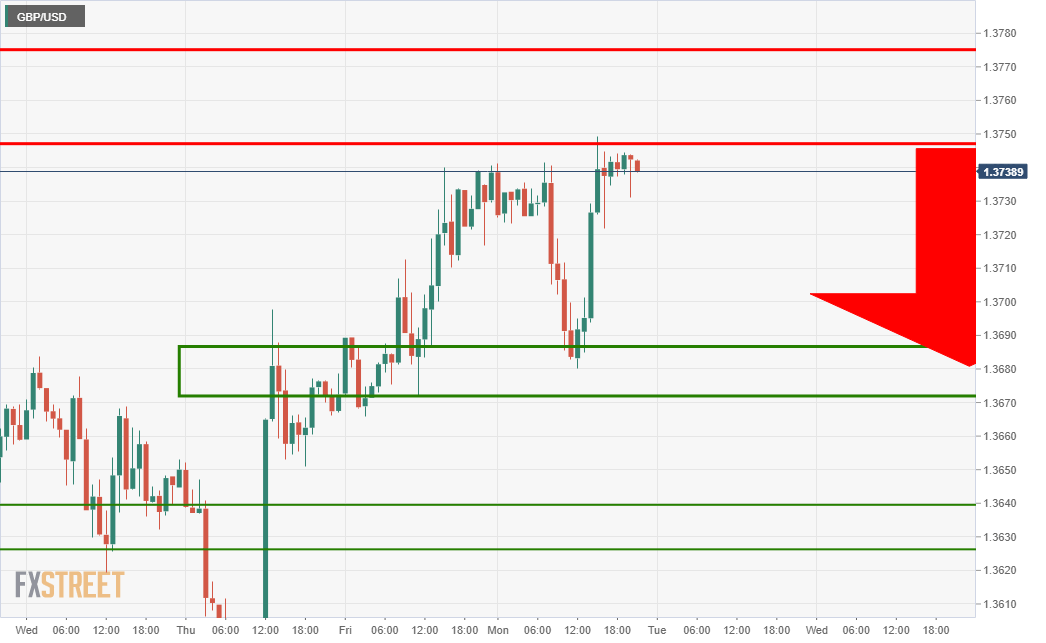
As can be seen, the price has already tested the area.
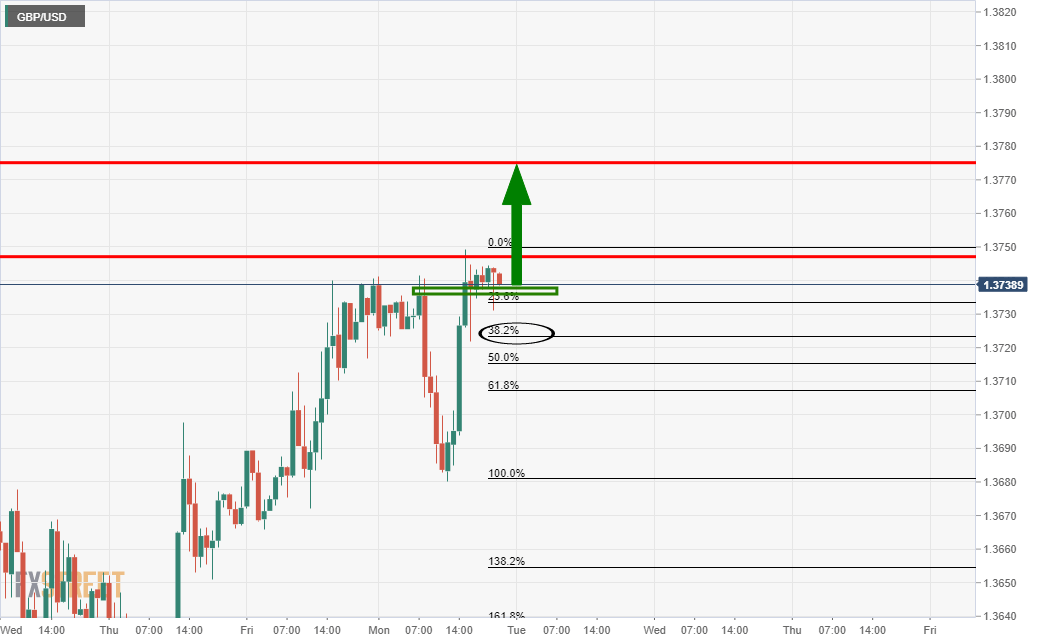
If the price breaks this meanwhile support, then bears can target a fuller test of the 38.2% Fibonacci of the hourly bullish impulse.
