- GBP/USD has bounced off the lows as UK second-quarter GDP beat estimates.
- Bleak labor market prospects, dollar haven flows, point to falls.
- Wednesday’s four-hour chart is painting a mixed picture.
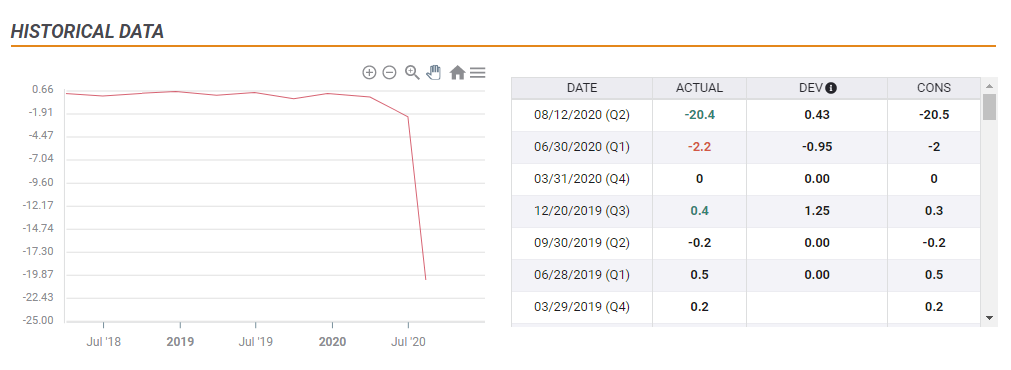
When a crash of a fifth in output is considered “better than expected” – there is reason to worry. The UK economy shrank by 20.4% in the second quarter of 2020, better than -20.5% projected. Year-over year, output fell by 21.7%, also above estimates.
Perhaps the truly encouraging figure is June’s monthly rebound of 8.7%, not only topping forecasts but showing that Britain’s gradual reopening also bears economic fruits. That recovery, accompanied by hopes that the uptrend continues in July and beyond, pushed the pound higher.
On the other hand, Chancellor Rishi Sunk is sending sterling lowe once again. Apart from reiterating that the furlough scheme – responsible for keeping the unemployment rate at 3.9% – is unsustainable, he added that many will lose their jobs.
While the pound is torn between both developments, the dollar remains strong. The greenback is benefiting from higher bond yields as the US issues a record amount of debt that investors are unable to absorb at low returns.
The world ´s reserve currency is also benefiting from safe-haven flows originating from the impasse on US fiscal stimulus – little news on that front – and Sino-American tensions ahead of trade talks.
Investors are skeptical about Russia’s announcement that it developed a COVID-19 vaccine and more worried that Texas will be keeping restrictions in place despite some improvement in battling the disease.
Wednesday’s main event is US Consumer Price Index statistics in the US.
See US CPI July Preview: Inflation loses its cachet
What about US-UK relations? Liz Truss, the UK International Trade Secretary, said progress continues to be made in talks – but without providing details, thus casting doubt about what has really been achieved.
All in all, the deck is stacked against cable.
GBP/USD Technical Analysis

Pound/dollar continues suffering from downside momentum on the four-hour chart, and trades below the 50 Simple Moving Average. On the other hand, it survived a dip below uptrend support, showing some strength.
Below that line, 1.3010 provided support a few days ago and provides support. It is followed by 1.2985, August’s trough. The next lines to watch are 1.29 and 1.2845.
Resistance is at 1.3070, where the 100 SMA hits the price, and then at 1.3135, the weekly high. Further above, 1.3170 and 1.3183 await cable.
More Market players don’t believe the US Congress will fail to get a second “stimulus” spending package
