- GBP/USD has been extending its falls after weak GDP and dovish BOE comments.
- Speculation about a UK rate cut weighs on the pound.
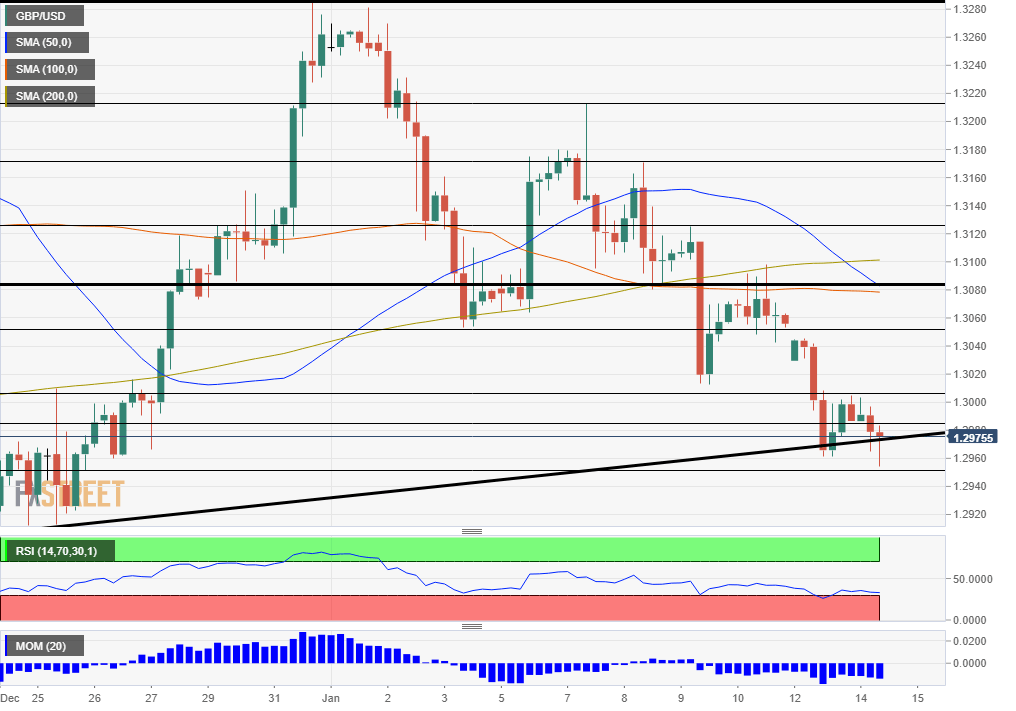
- Tuesday’s four-hour chart is showing that long-term support is at risk.
A UK rate cut is only a question of time – with rising chances that it may happen as soon as January 30 – one day before Brexit.
The pound has been reeling from the disappointing Gross Domestic Product figures published on Monday, which showed the economy contracted by 0.3% in November. The data was preceded by dovish comments from members of the Bank of England, first and foremost, from Mark Carney, the governor. His words about a “prompt” response were then followed up by additional calls for cutting rates.
RBS, one of Britain’s biggest banks, has updated its outlook and now foresees a 25 basis-point rate cut at the end of this month. Bond markets are more cautious, predicting a 50-50 chance of a decrease in May.
The recent economic deterioration is related to Brexit uncertainty. While the UK formally exits on January 31, it remains tied to the bloc until the end of the year, and Prime Minister Boris Johnson has reaffirmed his stance that Britain will not ask for an extension. Brussels previously expressed doubts and has other priorities – trade talks with the US, which kick off on Tuesday in Washington.
Sino-American trade optimism, US inflation data
The US is negotiating with the EU while Liu He, China’s Vice-Premier, is also in town to sign Phase One of the trade deal between the world’s largest countries. The US Treasury has removed the label “currency manipulator” from China, a token of goodwill that has been well-received by investors.
Later today, US Consumer Price Index figures are set to move the dollar. Annual Core CPI – the most significant data point – is set to remain unchanged at 2.3%. See the preview: The inflation sideshow
GBP/USD Technical Analysis
Pound/dollar has dropped below the long-term uptrend support line that was formed back in November. At the time of writing, the currency pair is still struggling, and the break is not confirmed.
Nevertheless, the picture remains bearish. Momentum is to the downside, and GBP/USD trades well below the 50, 100, and 200 Simple Moving Averages. Moreover, the Relative Strength Index is still above 30 – thus outside oversold conditions.
Support awaits at 1.2950, which is the daily low and previously worked as resistance. Next, 1.29 is a round number that cushioned the currency pair in December. It is closely followed by 1.2875, a resistance line from November.
GBP/USD is capped by 1.2985, which was November’s high and worked as resistance also in December. It is followed by 1.3010, October’s peak and also a swing high in Decembre. Next, 1.3045 provided support in early January, and 1.3080 had the same role shortly afterward.
