GBP/USD plunged from the highs after UK Attorney General Geoffrey Cox said that the legal risks around the Irish Backstop have not changed. His advice lowers the chance that Parliament will approve the deal. What’s next?
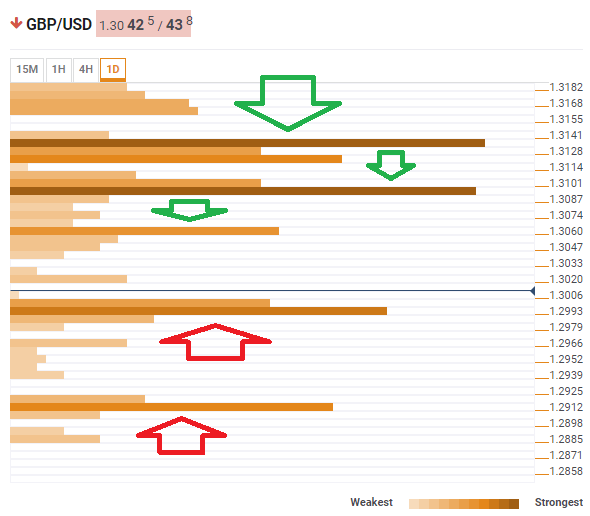
The Technical Confluences Indicator shows that cable is now hovering above critical support at around 1.3000. Apart from being a round number, we also see here the convergence of the Simple Moving Average 200-one-day, last week’s low, and the Fibonacci 61.8% one-month.
If pound/dollar loses this line, the next support line awaits at 1.2912 where we see the Pivot Point one-month Support 1 and the SMA 100-one-day.
Some resistance awaits at 1.3060 which is the meeting point of the Fibonacci 23.6% one-week and the SMA 200-4h.
A more considerable cap awaits at 1.3095 which is where the potent Fibonacci 38.2% one-day converges with the Fibonacci 38.2% one-week, the SMA 100-15m, and the BB 4h-Middle.
The most substantial resistance line is at 1.3135where the Fibonacci 38.2% one-month, the BB 1h-Middle, the SMA 100-4h, the SMA 5-1d, and the Fibonacci 23.6% one-day.
This is how it looks on the tool:
Confluence Detector
The Confluence Detector finds exciting opportunities using Technical Confluences. The TC is a tool to locate and point out those price levels where there is a congestion of indicators, moving averages, Fibonacci levels, Pivot Points, etc. Knowing where these congestion points are located is very useful for the trader, and can be used as a basis for different strategies.
This tool assigns a certain amount of “weight” to each indicator, and this “weight” can influence adjacents price levels. This means that one price level without any indicator or moving average but under the influence of two “strongly weighted” levels accumulate more resistance than their neighbors. In these cases, the tool signals resistance in apparently empty areas.
