- GBP/USD remains below six-week-old descending trend-line with bearish MACD signal.
- 4H 100MA, 23.6% Fibonacci retracement level limits immediate declines.
- An upward sloping trend-line since August 11 adds to the support.
With its sustained trading under a downward-sloping trend-line since July 18, coupled with bearish MACD signal, GBP/USD takes the rounds to 1.2218 on early Thursday.
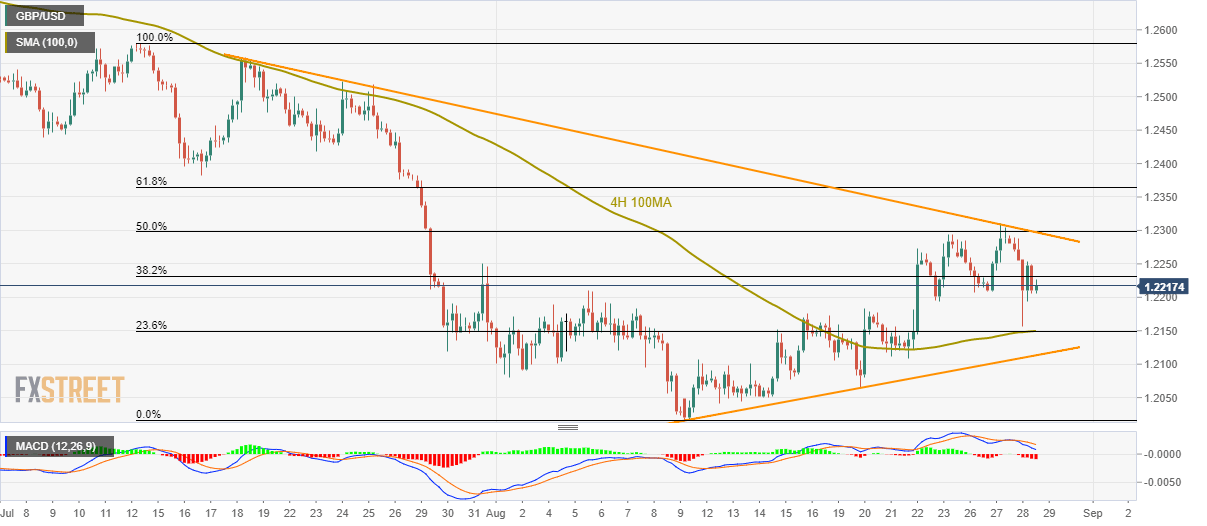
While bearish signal by 12-day moving average convergence and divergence (MACD) indicator and a strict follow-up of falling resistance-line indicate the Cable’s downpour, 100-bar moving average on the four-hour chart (4H 100MA) and 23.6% Fibonacci retracement of early-July to mid-August declines limit its near-term south-run around 1.2150.
In a case prices slip below 1.2150, a 13-day old rising trend-line at 1.2113 and August 20 low near 1.2064 will please sellers ahead of pushing the GBP/USD further towards 1.2000 round-figure.
Alternatively, 50% Fibonacci retracement and more than a month old declining trend-line restrict the pair’s near-term upside around 1.2300, a successful break of which can trigger fresh advances to 61.8% Fibonacci retracement level of 1.2365.
GBP/USD 4-hour chart
Trend: sideways
