- GBP/USD remains above 50-DMA amid bullish technical indicators.
- A sustained break of mid-July lows can validate the pair’s further upside.
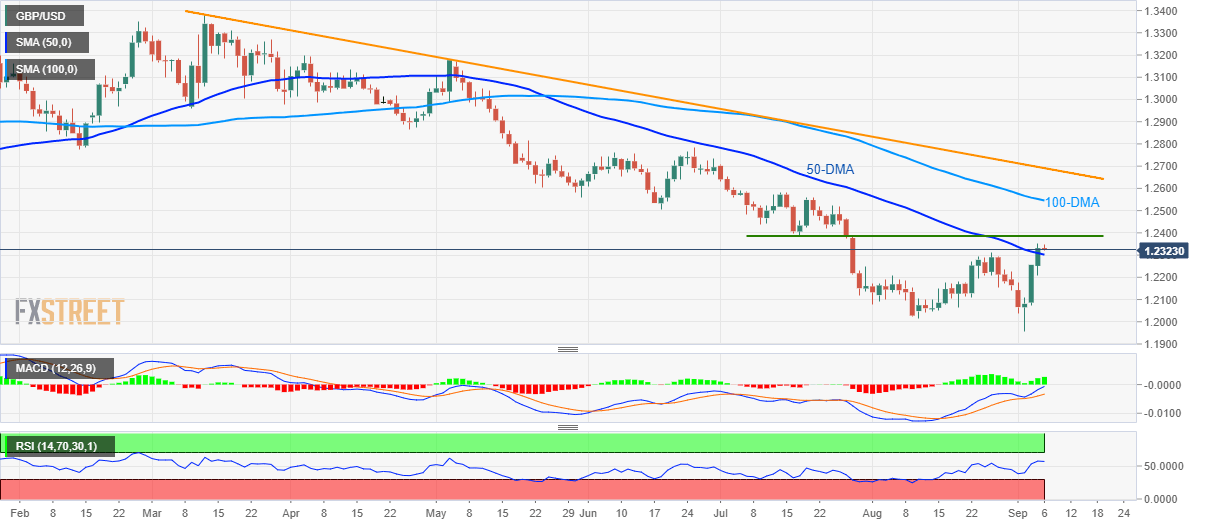
Even after staying beyond 50-day simple moving average (DMA) for the first time in four months, GBP/USD still refrain from further upside as it takes the rounds to 1.2320 while heading into the London open on Friday.
Given the price-positive signals from 12-bar moving average convergence and divergence (MACD) and 14-bar relative strength index (RSI), an upside break of 1.2380/85 area including mid-July lows can propel prices further towards 100-DMA level of 1.2545.
It should, however, be noted that pair’s run-up past-1.2545 will be questioned by a downward sloping trend-line since early-March, at 1.2690.
On the contrary, pair’s decline below 50-DMA level of 1.2300 could trigger fresh declines to initial August month highs near 1.2210/2200 whereas 1.2080 and 1.2015 can offer intermediate halts before the pair drops to 1.2000 mark that has mostly held the pair’s south-run confined.
GBP/USD daily chart
Trend: pullback expected
