- GBP/USD bounces off two-week-old support-line.
- 100-DMA, 38.2% Fibonacci retracement can question the pair’s recovery.
- Six-month long falling trend-line adds to the resistance.
Despite bouncing off near-term support-line, GBP/USD remains under pressure as it makes the rounds to 1.2420 ahead of the UK open on Tuesday.
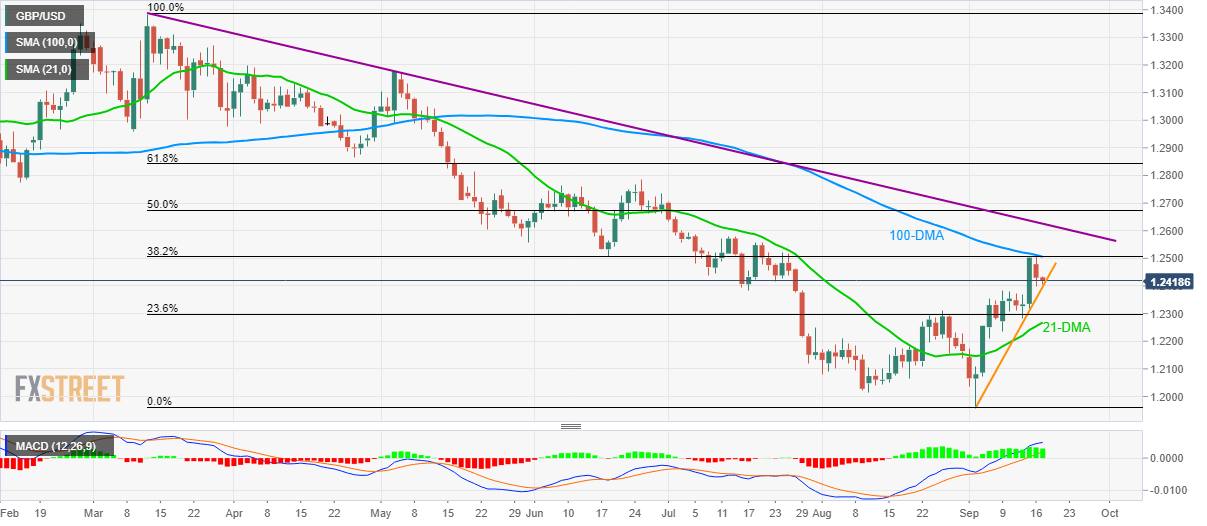
The pair needs to provide a daily closing beyond 1.2507/10 area, including 100-day simple moving average (DMA) and 38.2% Fibonacci retracement of March-September declines, in order to extend the latest recovery.
Even so, a downward sloping trend-line since March, at 1.2625, will challenge bulls targeting 50% Fibonacci retracement level of 1.2675 and June month high surrounding 1.2785.
Meanwhile, pair’s decline below immediate rising support-line, at 1.2400, could drag it back 23.6% Fibonacci retracement level of 1.2300 whereas 21-DMA level of 1.2270 could please sellers afterward.
GBP/USD daily chart
Trend: sideways
