- Sustained trading below 61.8% Fibo favors bears.
- Oversold RSI and 1.2700 questions further downside.
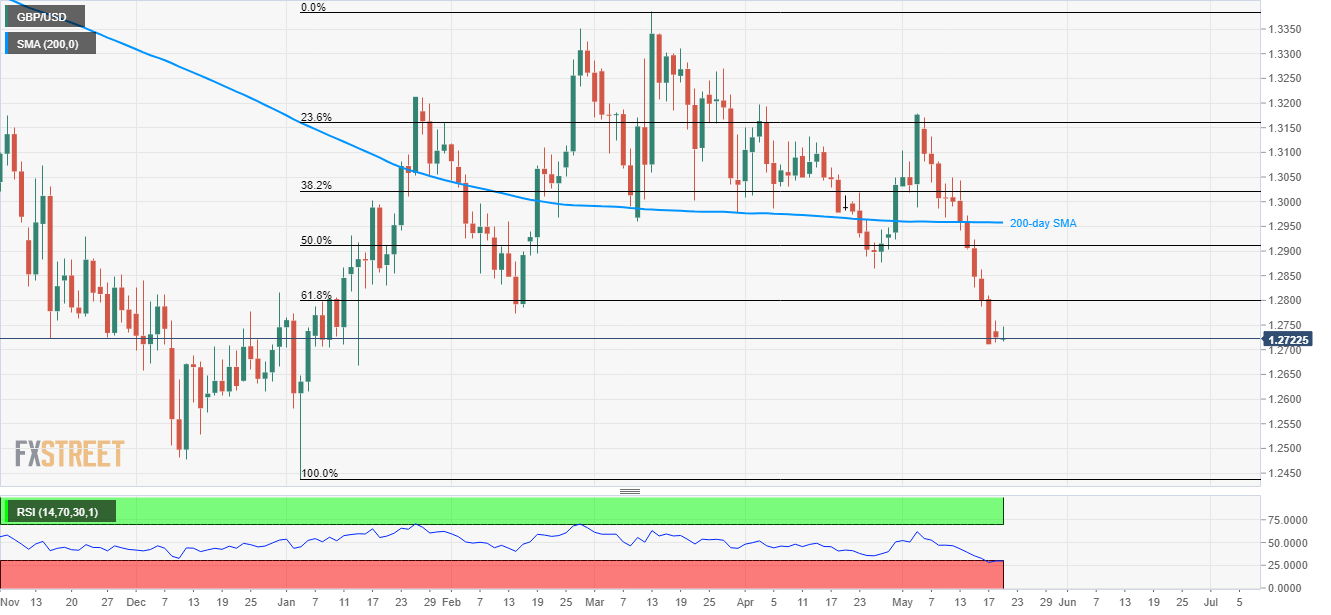
While sustained trading below 61.8% Fibonacci retracement of March month upside portrays GBP/USD weakness, repeated refrain to slip under 1.2700 round-figure question sellers as the quote flashes 1.2720 figure ahead of the London open on Tuesday.
Oversold levels of 14-day relative strength index (RSI) could also be considered as an additional challenge to the bears.
As a result, chances of the pair’s pullback towards February month low near 1.2770 and then to 61.8% Fibonacci retracement level adjacent to the 1.2800 round-figure seem brighter.
Given the buyer’s ability to cross 1.2800 resistance, April month low near 1.2865, 50% Fibonacci retracement near 1.2915 and 200-day simple moving average (SMA) around 1.2960 could become their favorites.
If at all bears manage to conquer 1.2700 round-figure, January 15 bottom around 1.2670, and 1.2600 can mark their presence on the chart.
Additionally, pair’s extended downturn beneath 1.2600 can avail intermediate halt at January 02 low of 1.2580 ahead of revisiting January month low near 1.2440.
GBP/USD daily chart
Trend: Pullback expected
