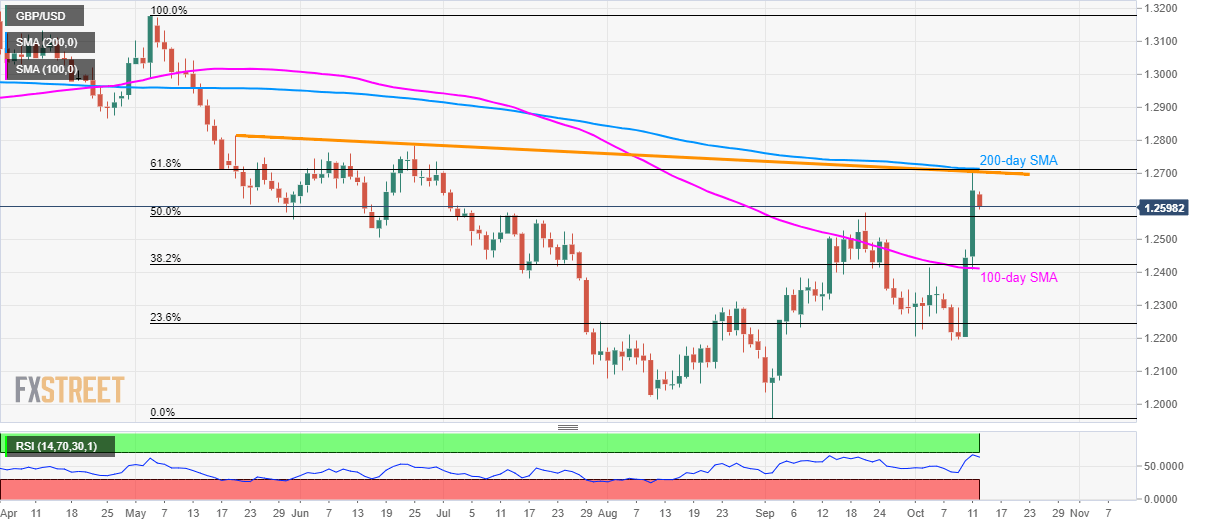
- GBP/USD steps back from the key resistance-confluence.
- 50% Fibonacci retracement can entertain short-term sellers while 100-day SMA could question bears afterward.
Failure to cross the key resistance confluence presently drags the GBP/USD pair downwards to 1.2600 while heading into the London open on Monday.
The pair now aims for 50% Fibonacci retracement of May-September declines, at 1.2568, during further declines. However, 100-day Simple Moving Average (SMA), near 1.2410 now, can limit the pair’s additional south-run.
Also supporting the sellers is overbought conditions of 14-bar Relative Strength Index (RSI).
Should bears refrain from respecting 1.2410 rest-point, early-month low nearing 1.2195 will flash on their radar.
Alternatively, 61.8% Fibonacci retracement, 200-day SMA and a falling trend-line since May 21 limit the pair’s upside around 1.2705/15, a break of which could escalate the run-up to June month high surrounding 1.2785.
During the pair’s extended rise past-1.2785, 1.2815 and 1.2865 will becomes bulls’ favorites.
GBP/USD daily chart
Trend: pullback expected

