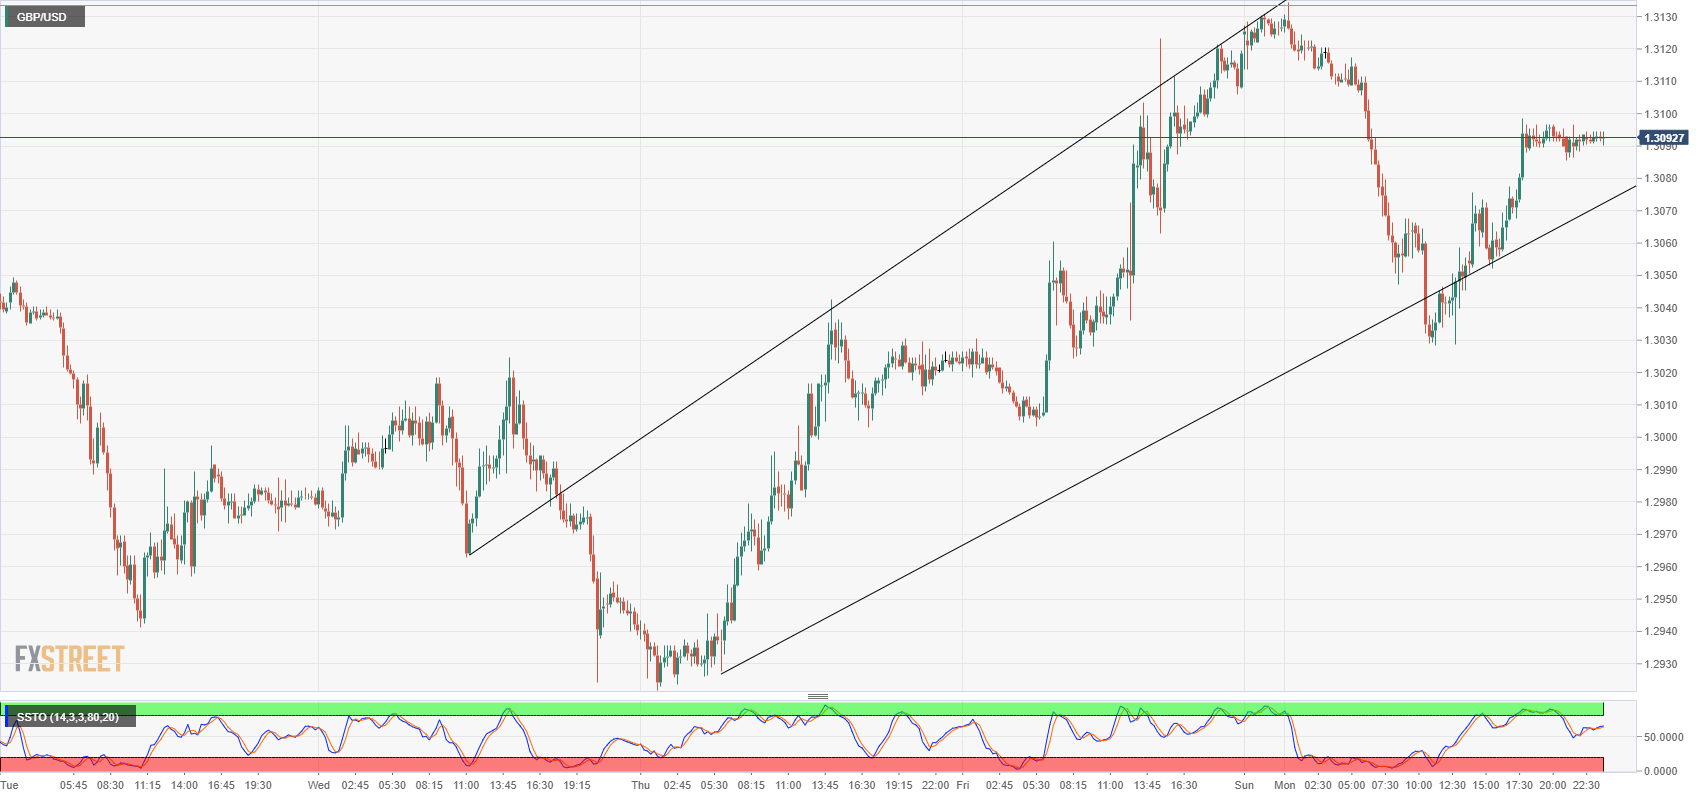
- The Cable is constrained by the 1.31 technical handle in early consolidation as traders look for a breakout.
- A rising trendline from near-term lows coincides with a rising 200-hour EMA from 1.3070 providing support, while resistance sits at the week’s peak of 1.3130.
- Medium-term, the US Dollar remains well-bid, and Sterling bulls should use caution when buying against the crowd, especially as Brexit headlines threaten to shake out Cable bids once more.
GBP/USD
Overview:
Last Price: 1.31
Daily change: 10 pips
Daily change: 0.0764%
Daily Open: 1.309
Trends:
Daily SMA20: 1.3091
Daily SMA50: 1.2972
Daily SMA100: 1.3108
Daily SMA200: 1.3498
Levels:
Daily High: 1.3134
Daily Low: 1.3028
Weekly High: 1.3123
Weekly Low: 1.2922
Monthly High: 1.33
Monthly Low: 1.2897
Daily Fibonacci 38.2%: 1.3069
Daily Fibonacci 61.8%: 1.3094
Daily Pivot Point S1: 1.3034
Daily Pivot Point S2: 1.2978
Daily Pivot Point S3: 1.2927
Daily Pivot Point R1: 1.314
Daily Pivot Point R2: 1.319
Daily Pivot Point R3: 1.3246
