- GBP/USD hourly chart shows a bearish divergence of the relative strength index (RSI). The stochastic has generated a sell signal and is about to roll over from the overbought territory in favor of the bears.
- As a result, the resistance at 1.3155 (200-hour moving average) will likely hold at least for the next few hours.
Hourly chart
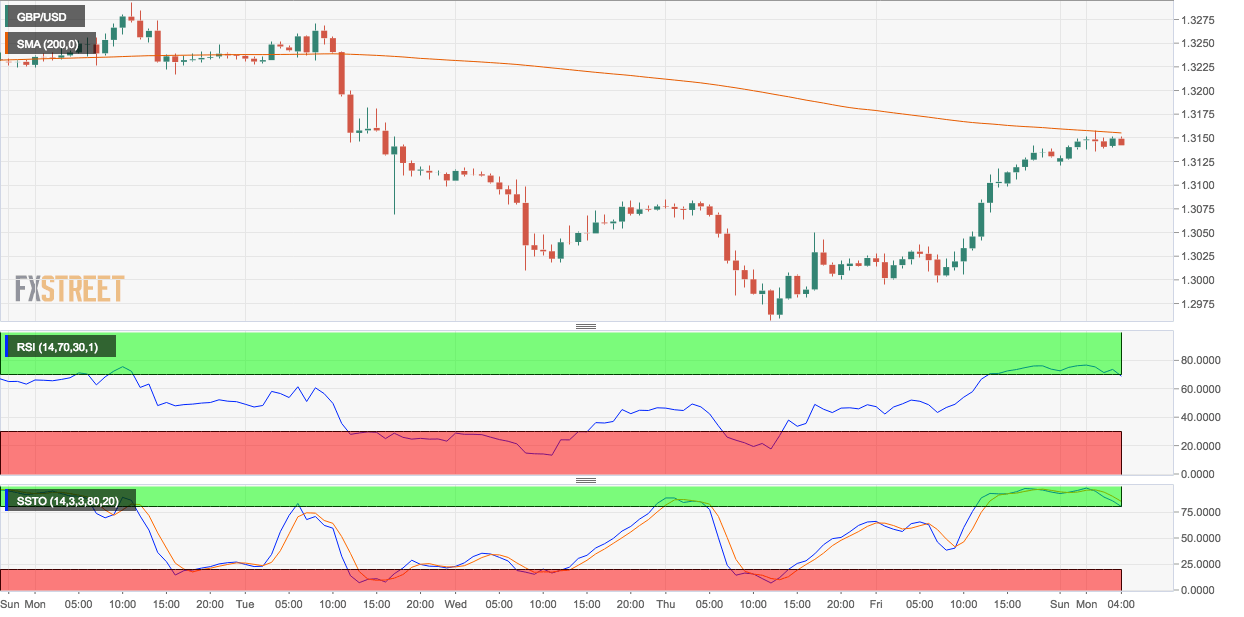
Spot Rate: 1.3144
Daily High: 1.3157
Daily Low: 1.3120
Trend: mildy bearish
R1: 1.3162 (10-day moving average)
R2: 1.3276 (50-day moving average)
R3: 1.3293 (July 16 high)
Support
S1: 1.3120 (session low)
S2: 1.3190 (5-day moving average)
S3: 1.3089 (100-hour moving average)
